
Article Categories
- All Categories
-
 Data Structure
-
 Networking
-
 RDBMS
RDBMS
-
 Operating System
-
 Java
Java
-
 MS Excel
-
 iOS
iOS
-
 HTML
HTML
-
 CSS
CSS
-
 Android
-
 Python
-
 C Programming
-
 C++
C++
-
 C#
C#
-
 MongoDB
-
 MySQL
MySQL
-
 Javascript
-
 PHP
PHP
-
 Economics & Finance
Selected Reading
How should I pass a matplotlib object through a function; as Axis, Axes or Figure?
To pass a matplotlib object through a function; as Axis, Axes or figure, we can take the following steps −
- Set the figure size and adjust the padding between and around the subplots.
- In plot() method, plot x and y data points at axes ax.
- In profile() method, create a figure and a set of subplots. Iterate the axes and pass in plot() method to plot the figure.
- Call the profile() method with 3 rows and 4 columns.
- To display the figure, use show() method.
Example
import numpy as np
from matplotlib import pyplot as plt
plt.rcParams["figure.figsize"] = [7.00, 3.50]
plt.rcParams["figure.autolayout"] = True
def plot(ax, x, y):
ax.plot(x, y)
def profile(rows, cols):
fig, axes = plt.subplots(rows, cols)
for ax in axes:
for a in ax:
plot(a, np.random.rand(10), np.random.rand(10))
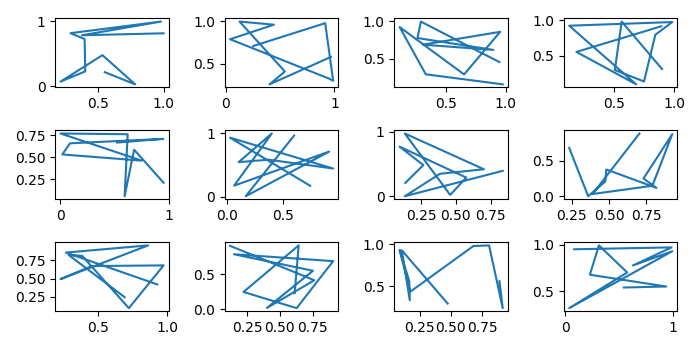
profile(3, 4)
plt.show()
Output
It will produce the following output


Updated on: 2021-09-22T06:47:53+05:30
2K+ Views

Advertisements