- Data Science - Home
- Data Science - Getting Started
- Data Science - What is Data?
- Data science - Lifecycle
- Data Science - Prerequisites
- Data Science - Applications
- Data Science - Machine Learning
- Data Science - Data Analysis
- Data Science - Tools in Demand
- Data Science - Careers
- Data Science - Scientists
- Data Scientist - Salary
- Data Science - Resources
- Data Science - Interview Questions
- Data Science Useful Resources
- Data Science - Quick Guide
- Data Science - Useful Resources
- Data Science - Discussion
Data Science - What is Data?
What is Data in Data Science?
Data is the foundation of data science. Data is the systematic record of a specified characters, quantity or symbols on which operations are performed by a computer, which may be stored and transmitted. It is a compilation of data to be utilised for a certain purpose, such as a survey or an analysis. When structured, data may be referred to as information. The data source (original data, secondary data) is also an essential consideration.
Data comes in many shapes and forms, but can generally be thought of as being the result of some random experiment - an experiment whose outcome cannot be determined in advance, but whose workings are still subject to analysis. Data from a random experiment are often stored in a table or spreadsheet. A statistical convention to denote variables is often called as features or columns and individual items (or units) as rows.
Types of Data
There are mainly two types of data, they are −
Qualitative Data
Qualitative data consists of information that cannot be counted, quantified, or expressed simply using numbers. It is gathered from text, audio, and pictures and distributed using data visualization tools, including word clouds, concept maps, graph databases, timelines, and infographics.
The objective of qualitative data analysis is to answer questions about the activities and motivations of individuals. Collecting, and analyzing this kind of data may be time-consuming. A researcher or analyst that works with qualitative data is referred to as a qualitative researcher or analyst.
Qualitative data can give essential statistics for any sector, user group, or product.
Types of Qualitative Data
There are mainly two types of Qualitative data, they are −
Nominal Data
In statistics, nominal data (also known as nominal scale) is used to designate variables without giving a numerical value. It is the most basic type of measuring scale. In contrast to ordinal data, nominal data cannot be ordered or quantified.
For example, The name of the person, the colour of the hair, nationality, etc. Lets assume a girl named Aby her hair is brown and she is from America.
Nominal data may be both qualitative and quantitative. Yet, there is no numerical value or link associated with the quantitative labels (e.g., identification number). In contrast, several qualitative data categories can be expressed in nominal form. These might consist of words, letters, and symbols. Names of individuals, gender, and nationality are some of the most prevalent instances of nominal data.
Analyze Nominal Data
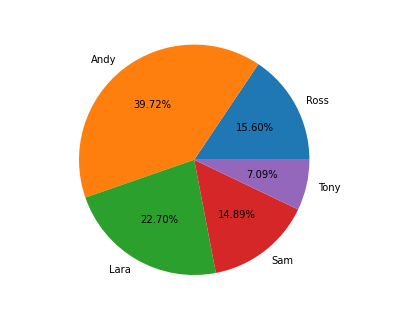
Using the grouping approach, nominal data can be analyzed. The variables may be sorted into groups, and the frequency or percentage can be determined for each category. The data may also be shown graphically, for example using a pie chart.
Although though nominal data cannot be processed using mathematical operators, they may still be studied using statistical techniques. Hypothesis testing is one approach to assess and analyse the data.
With nominal data, nonparametric tests such as the chi-squared test may be used to test hypotheses. The purpose of the chi-squared test is to evaluate whether there is a statistically significant discrepancy between the predicted frequency and the actual frequency of the provided values.
Ordinal Data
Ordinal data is a type of data in statistics where the values are in a natural order. One of the most important things about ordinal data is that you can't tell what the differences between the data values are. Most of the time, the width of the data categories doesn't match the increments of the underlying attribute.
In some cases, the characteristics of interval or ratio data can be found by grouping the values of the data. For instance, the ranges of income are ordinal data, while the actual income is ratio data.
Ordinal data can't be changed with mathematical operators like interval or ratio data can. Because of this, the median is the only way to figure out where the middle of a set of ordinal data is.
This data type is widely found in the fields of finance and economics. Consider an economic study that examines the GDP levels of various nations. If the report rates the nations based on their GDP, the rankings are ordinal statistics.
Analyzing Ordinal Data
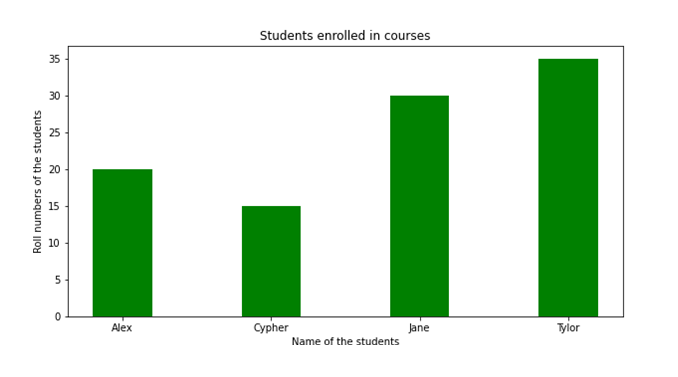
Using visualisation tools to evaluate ordinal data is the easiest method. For example, the data may be displayed as a table where each row represents a separate category. In addition, they may be represented graphically using different charts. The bar chart is the most popular style of graph used to display these types of data.
Ordinal data may also be studied using sophisticated statistical analysis methods like hypothesis testing. Note that parametric procedures such as the t-test and ANOVA cannot be used to these data sets. Only nonparametric tests, such as the Mann-Whitney U test or Wilcoxon Matched-Pairs test, may be used to evaluate the null hypothesis about the data.
Qualitative Data Collection Methods
Below are some approaches and collection methods to collect qualitative data −
Data Records − Utilizing data that is already existing as the data source is a best technique to do qualitative research. Similar to visiting a library, you may examine books and other reference materials to obtain data that can be utilised for research.
Interviews − Personal interviews are one of the most common ways to get deductive data for qualitative research. The interview may be casual and not have a set plan. It is often like a conversation. The interviewer or researcher gets the information straight from the interviewee.
Focus Groups − Focus groups are made up of 6 to 10 people who talk to each other. The moderator's job is to keep an eye on the conversation and direct it based on the focus questions.
Case Studies − Case studies are in-depth analyses of an individual or group, with an emphasis on the relationship between developmental characteristics and the environment.
Observation − It is a technique where the researcher observes the object and take down transcript notes to find out innate responses and reactions without prompting.
Quantitative Data
Quantitative data consists of numerical values, has numerical features, and mathematical operations can be performed on this type of data such as addition. Quantitative data is mathematically verifiable and evaluable due to its quantitative character.
The simplicity of their mathematical derivations makes it possible to govern the measurement of different parameters. Typically, it is gathered for statistical analysis through surveys, polls, or questionnaires given to a subset of a population. Researchers are able to apply the collected findings to an entire population.
Types of Quantitative Data
There are mainly two types of quantitative data, they are −
Discrete Data
These are data that can only take on certain values, as opposed to a range. For instance, data about the blood type or gender of a population is considered discrete data.
Example of discrete quantitative data may be the number of visitors to your website; you could have 150 visits in one day, but not 150.6 visits. Usually, tally charts, bar charts, and pie charts are used to represent discrete data.
Characteristics of Discrete Data
Since it is simple to summarise and calculate discrete data, it is often utilized in elementary statistical analysis. Let's examine some other essential characteristics of discrete data −
Discrete data is made up of discrete variables that are finite, measurable, countable, and can't be negative (5, 10, 15, and so on).
Simple statistical methods, like bar charts, line charts, and pie charts, make it easy to show and explain discrete data.
Data can also be categorical, which means it has a fixed number of data values, like a person's gender.
Data that is both time- and space-bound is spread out in a random way. Discrete distributions make it easier to look at discrete values.
Continuous Data
These are data that may take values between a certain range, including the greatest and lowest possible. The difference between the greatest and least value is known as the data range. For instance, the height and weight of your school's children. This is considered continuous data. The tabular representation of continuous data is known as a frequency distribution. These may be depicted visually using histograms.
Characteristics of continuous data
Continuous data, on the other hand, can be either numbers or spread out over time and date. This data type uses advanced statistical analysis methods because there are an infinite number of possible values. The important characteristics about continuous data are −
Continuous data changes over time, and at different points in time, it can have different values.
Random variables, which may or may not be whole numbers, make up continuous data.
Data analysis tools like line graphs, skews, and so on are used to measure continuous data.
One type of continuous data analysis that is often used is regression analysis.
Quantitative Data Collection Methods
Below are some approaches and collection methods to collect quantitative data −
Surveys and Questionnaires − These types of research are good for getting detailed feedback from users and customers, especially about how people feel about a product, service, or experience.
Open-source Datasets − There are a lot of public datasets that can be found online and analysed for free. Researchers sometimes look at data that has already been collected and try to figure out what it means in a way that fits their own research project.
Experiments − A common method is an experiment, which usually has a control group and an experimental group. The experiment is set up so that it can be controlled and the conditions can be changed as needed.
Sampling − When there are a lot of data points, it may not be possible to survey each person or data point. In this case, quantitative research is done with the help of sampling. Sampling is the process of choosing a sample of data that is representative of the whole. The two types of sampling are Random sampling (also called probability sampling), and non-random sampling.
Types of Data Collection
Data collection can be classified into two types according to the source −
Primary Data − These are the data that are acquired for the first time for a particular purpose by an investigator. Primary data are 'pure' in the sense that they have not been subjected to any statistical manipulations and are authentic. Examples of primary data include the Census of India.
Secondary Data − These are the data that were initially gathered by a certain entity. This indicates that this kind of data has already been gathered by researchers or investigators and is accessible in either published or unpublished form. This data is impure because statistical computations may have previously been performed on it. For example, Information accessible on the website of the Government of India or the Department of Finance, or in other archives, books, journals, etc.
Big Data
Big data is defined as data with a larger volume and require overcoming logistical challenges to deal with them. Big data refers to bigger, more complicated data collections, particularly from novel data sources. Some data sets are so extensive that conventional data processing software is incapable of handling them. But, these vast quantities of data can be use to solve business challenges that were previously unsolvable.
Data Science is the study of how to analyse huge amount of data and get the information from them. You can compare big data and data science to crude oil and an oil refinery. Data Science and big data grew out of statistics and traditional ways of managing data, but they are now seen as separate fields.
People often use the three Vs to describe the characteristics of big data −
Volume − How much information is there?
Variety − How different are the different kinds of data?
Velocity − How fast do new pieces of information get made?
How do we use Data in Data Science?
Every data must undergo pre-processing. This is an essential series of processes that converts raw data into a more comprehensible and valuable format for further processing. Common procedures are −
Collect and Store the Dataset
Data Cleaning
Handling Missing data
Noisy Data
Data Integration
Data Transformation
Generalization
Normalization
Attribute Selection
Aggregation
We will discuss these processes in detail in upcoming chapters.