- Data Science - Home
- Data Science - Getting Started
- Data Science - What is Data?
- Data science - Lifecycle
- Data Science - Prerequisites
- Data Science - Applications
- Data Science - Machine Learning
- Data Science - Data Analysis
- Data Science - Tools in Demand
- Data Science - Careers
- Data Science - Scientists
- Data Scientist - Salary
- Data Science - Resources
- Data Science - Interview Questions
- Data Science Useful Resources
- Data Science - Quick Guide
- Data Science - Useful Resources
- Data Science - Discussion
Data Science - Lifecycle
What is Data Science Lifecycle?
A data science lifecycle is a systematic approach to find a solution for a data problem which shows the steps that are taken to develop, deliver/deploy , and maintain a data science project. We can assume a general data science lifecycle with some of the most important common steps that is shown in the figure given below but some steps may differ from project to project as each project is different so life cycle may differ since not every data science project is built the same way
A standard data science lifecycle approach comprises the use of machine learning algorithms and statistical procedures that result in more accurate prediction models. Data extraction, preparation, cleaning, modelling, assessment, etc., are some of the most important data science stages. This technique is known as "Cross Industry Standard Procedure for Data Mining" in the field of data science.
How many phases are there in the Data Science Life Cycle?
There are mainly six phases in Data Science Life Cycle −
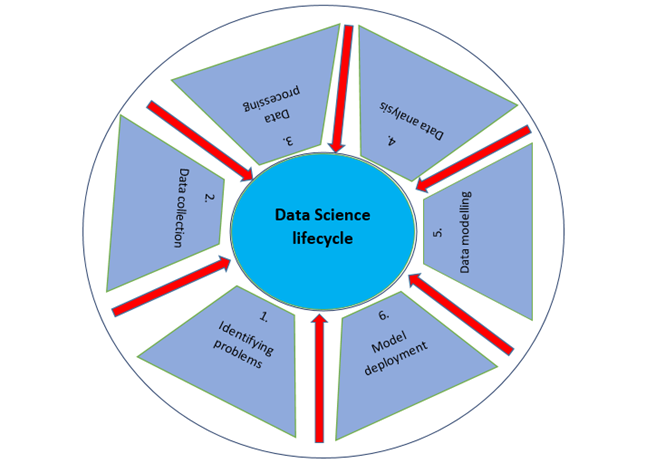
Identifying Problem and Understanding the Business
The data science lifecycle starts with "why?" just like any other business lifecycle. One of the most important parts of the data science process is figuring out what the problem is. This helps to find a clear goal around which all the other steps can be planned out. In short, it's important to know the business goal as earliest because it will determine what the end goal of the analysis will be.
This phase should evaluate the trends of business, assess case studies of comparable analyses, and research the industrys domain. The group will evaluate the feasibility of the project given the available employees, equipment, time, and technology. When these factors been discovered and assessed, a preliminary hypothesis will be formulated to address the business issues resulting from the existing environment. This phrase should −
Specify the issue that why the problem must be resolved immediately and demands answer.
Specify the business project's potential value.
Identify dangers, including ethical concerns, associated with the project.
Create and convey a flexible, highly integrated project plan.
Data Collection
The next step in the data science lifecycle is data collection, which means getting raw data from the appropriate and reliable source. The data that is collected can be either organized or unorganized. The data could be collected from website logs, social media data, online data repositories, and even data that is streamed from online sources using APIs, web scraping, or data that could be in Excel or any other source.
The person doing the job should know the difference between the different data sets that are available and how an organization invests its data. Professionals find it hard to keep track of where each piece of data comes from and whether it is up to date or not. During the whole lifecycle of a data science project, it is important to keep track of this information because it could help test hypotheses or run any other new experiments.
The information may be gathered by surveys or the more prevalent method of automated data gathering, such as internet cookies which is the primary source of data that is unanalysed.
We can also use secondary data which is an open-source dataset. There are many available websites from where we can collect data for example
Kaggle (https://www.kaggle.com/datasets),
Google Public Datasets (https://cloud.google.com/bigquery/public-data/)
There are some predefined datasets available in python. Lets import the Iris dataset from python and use it to define phases of data science.
from sklearn.datasets import load_iris
import pandas as pd

# Load Data
iris = load_iris()

# Create a dataframe
df = pd.DataFrame(iris.data, columns = iris.feature_names)
df['target'] = iris.target
X = iris.data
Data Processing
After collecting high-quality data from reliable sources, next step is to process it. The purpose of data processing is to ensure if there is any problem with the acquired data so that it can be resolved before proceeding to the next phase. Without this step, we may produce mistakes or inaccurate findings.
There may be several difficulties with the obtained data. For instance, the data may have several missing values in multiple rows or columns. It may include several outliers, inaccurate numbers, timestamps with varying time zones, etc. The data may potentially have problems with date ranges. In certain nations, the date is formatted as DD/MM/YYYY, and in others, it is written as MM/DD/YYYY. During the data collecting process numerous problems can occur, for instance, if data is gathered from many thermometers and any of them are defective, the data may need to be discarded or recollected.
At this phase, various concerns with the data must be resolved. Several of these problems have multiple solutions, for example, if the data includes missing values, we can either replace them with zero or the column's mean value. However, if the column is missing a large number of values, it may be preferable to remove the column completely since it has so little data that it cannot be used in our data science life cycle method to solve the issue.
When the time zones are all mixed up, we cannot utilize the data in those columns and may have to remove them until we can define the time zones used in the supplied timestamps. If we know the time zones in which each timestamp was gathered, we may convert all timestamp data to a certain time zone. In this manner, there are a number of strategies to address concerns that may exist in the obtained data.
We will access the data and then store it in a dataframe using python.
from sklearn.datasets import load_iris
import pandas as pd
import numpy as np

# Load Data
iris = load_iris()

# Create a dataframe
df = pd.DataFrame(iris.data, columns = iris.feature_names)
df['target'] = iris.target
X = iris.data
All data must be in numeric representation for machine learning models. This implies that if a dataset includes categorical data, it must be converted to numeric values before the model can be executed. So we will be implementing label encoding.
Label Encoding
species = []
for i in range(len(df['target'])):
   if df['target'][i] == 0:
      species.append("setosa")
   elif df['target'][i] == 1:
      species.append('versicolor')
   else:
      species.append('virginica')
df['species'] = species
labels = np.asarray(df.species)
df.sample(10)
labels = np.asarray(df.species)
from sklearn.preprocessing import LabelEncoder
le = LabelEncoder()
le.fit(labels)
labels = le.transform(labels)
df_selected1 = df.drop(['sepal length (cm)', 'sepal width (cm)', "species"], axis=1)
Data Analysis
Data analysis Exploratory Data Analysis (EDA) is a set of visual techniques for analysing data. With this method, we may get specific details on the statistical summary of the data. Also, we will be able to deal with duplicate numbers, outliers, and identify trends or patterns within the collection.
At this phase, we attempt to get a better understanding of the acquired and processed data. We apply statistical and analytical techniques to make conclusions about the data and determine the link between several columns in our dataset. Using pictures, graphs, charts, plots, etc., we may use visualisations to better comprehend and describe the data.
Professionals use data statistical techniques such as the mean and median to better comprehend the data. Using histograms, spectrum analysis, and population distribution, they also visualise data and evaluate its distribution patterns. The data will be analysed based on the problems.
Example
Below code is used to check if there are any null values in the dataset −
df.isnull().sum()
Output
sepal length (cm) 0
sepal width (cm) 0
petal length (cm) 0
petal width (cm) 0
target 0
species 0
dtype: int64
From the above output we can conclude that there are no null values in the dataset as the sum of all the null values in the column is 0.
We will be using shape parameter to check the shape (rows, columns) of the dataset −
Example
df.shape
Output
(150, 5)
Now we will use info() to check the columns and their data types −
Example
df.info()
Output
<class 'pandas.core.frame.DataFrame'>
RangeIndex: 150 entries, 0 to 149
Data columns (total 5 columns):
 #   Column             Non-Null Count  Dtype
---  ------             --------------  -----
 0   sepal length (cm)  150 non-null    float64
 1   sepal width (cm)   150 non-null    float64
 2   petal length (cm)  150 non-null    float64
 3   petal width (cm)   150 non-null    float64
 4   target             150 non-null    int64
dtypes: float64(4), int64(1)
memory usage: 6.0 KB
Only one column contains category data, whereas the other columns include non-Null numeric values.
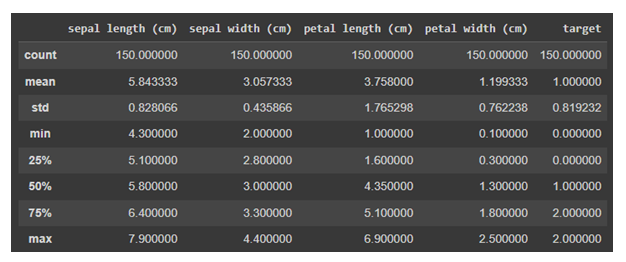
Now we will use describe() on the data. The describe() method performs fundamental statistical calculations to a dataset, such as extreme values, the number of data points, standard deviation, etc. Any missing or NaN values are immediately disregarded. The describe() method accurately depicts the distribution of data.
Example
df.describe()
Output
Data Visualization
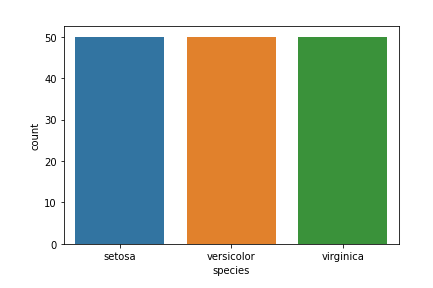
Target column − Our target column will be the Species column since we will only want results based on species in the end.
Matplotlib and seaborn library will be used for data visualization.
Below is the species countplot −
Example
import seaborn as sns
import matplotlib.pyplot as plt

sns.countplot(x='species', data=df, )
plt.show()
Output
There are many other visualization plots in Data Science. To know more about them refer https://www.tutorialspoint.com/machine_learning_with_python
Data Modeling
Data Modeling is one of the most important aspects of data science and is sometimes referred to as the core of data analysis. The intended output of a model should be derived from prepared and analysed data. The environment required to execute the data model will be chosen and constructed, before achieving the specified criteria.
At this phase, we develop datasets for training and testing the model for production-related tasks. It also involves selecting the correct mode type and determining if the problem involves classification, regression, or clustering. After analysing the model type, we must choose the appropriate implementation algorithms. It must be performed with care, as it is crucial to extract the relevant insights from the provided data.
Here machine learning comes in picture. Machine learning is basically divided into classification, regression, or clustering models and each model have some algorithms which is applied on the dataset to get the relevant information. These models are used in this phase. We will discuss these models in detail in the machine learning chapter.
Model Deployment
We have reached the final stage of the data science lifecycle. The model is finally ready to be deployed in the desired format and chosen channel after a detailed review process. Note that the machine learning model has no utility unless it is deployed in the production. Generally speaking, these models are associated and integrated with products and applications.
Model Deployment contains the establishment of a delivery method necessary to deploy the model to market consumers or to another system. Machine learning models are also being implemented on devices and gaining acceptance and appeal. Depending on the complexity of the project, this stage might range from a basic model output on a Tableau Dashboard to a complicated cloud-based deployment with millions of users.
Who are all involved in Data Science lifecycle?
Data is being generated, collected, and stored on voluminous servers and data warehouses from the individual level to the organisational level. But how will you access this massive data repository? This is where the data scientist comes in, since he or she is a specialist in extracting insights and patterns from unstructured text and statistics.
Below, we present the many job profiles of the data science team participating in the data science lifecycle.
| S.No | Job Profile & Role |
|---|---|
| 1 | Business Analyst
Understanding business requirements and find the right target customers. |
| 2 | Data Analyst
Format and clean the raw data, interpret and visualise them to perform the analysis and provide the technical summary of the same |
| 3 | Data Scientists
Improve quality of machine learning models. |
| 4 | Data Engineer
They are in charge of gathering data from social networks, websites, blogs, and other internal and external web sources ready for further analysis. |
| 5 | Data Architect
Connect, centralise, protect, and keep up with the organization's data sources. |
| 6 | Machine Learning Engineer
Design and implement machine learning-related algorithms and applications. |