- PyTorch - Home
- PyTorch - Introduction
- PyTorch - Installation
- Mathematical Building Blocks of Neural Networks
- PyTorch - Neural Network Basics
- Universal Workflow of Machine Learning
- Machine Learning vs. Deep Learning
- Implementing First Neural Network
- Neural Networks to Functional Blocks
- PyTorch - Terminologies
- PyTorch - Loading Data
- PyTorch - Linear Regression
- PyTorch - Convolutional Neural Network
- PyTorch - Recurrent Neural Network
- PyTorch - Datasets
- PyTorch - Introduction to Convents
- Training a Convent from Scratch
- PyTorch - Feature Extraction in Convents
- PyTorch - Visualization of Convents
- Sequence Processing with Convents
- PyTorch - Word Embedding
- PyTorch - Recursive Neural Networks
- PyTorch Useful Resources
- PyTorch - Quick Guide
- PyTorch - Useful Resources
- PyTorch - Discussion
PyTorch - Visualization of Convents
In this chapter, we will be focusing on the data visualization model with the help of convents. Following steps are required to get a perfect picture of visualization with conventional neural network.
Step 1
Import the necessary modules which is important for the visualization of conventional neural networks.
import os
import numpy as np
import pandas as pd
from scipy.misc import imread
from sklearn.metrics import accuracy_score

import keras
from keras.models import Sequential, Model
from keras.layers import Dense, Dropout, Flatten, Activation, Input
from keras.layers import Conv2D, MaxPooling2D
import torch
Step 2
To stop potential randomness with training and testing data, call the respective data set as given in the code below −
seed = 128
rng = np.random.RandomState(seed)
data_dir = "../../datasets/MNIST"
train = pd.read_csv('../../datasets/MNIST/train.csv')
test = pd.read_csv('../../datasets/MNIST/Test_fCbTej3.csv')
img_name = rng.choice(train.filename)
filepath = os.path.join(data_dir, 'train', img_name)
img = imread(filepath, flatten=True)
Step 3
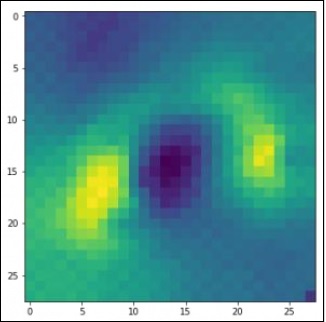
Plot the necessary images to get the training and testing data defined in perfect way using the below code −
pylab.imshow(img, cmap ='gray')
pylab.axis('off')
pylab.show()
The output is displayed as below −
Advertisements