- Python Pandas - Home
- Python Pandas - Introduction
- Python Pandas - Environment Setup
- Python Pandas - Basics
- Python Pandas - Introduction to Data Structures
- Python Pandas - Index Objects
- Python Pandas - Panel
- Python Pandas - Basic Functionality
- Python Pandas - Indexing & Selecting Data
- Python Pandas - Series
- Python Pandas - Series
- Python Pandas - Slicing a Series Object
- Python Pandas - Attributes of a Series Object
- Python Pandas - Arithmetic Operations on Series Object
- Python Pandas - Converting Series to Other Objects
- Python Pandas - DataFrame
- Python Pandas - DataFrame
- Python Pandas - Accessing DataFrame
- Python Pandas - Slicing a DataFrame Object
- Python Pandas - Modifying DataFrame
- Python Pandas - Removing Rows from a DataFrame
- Python Pandas - Arithmetic Operations on DataFrame
- Python Pandas - IO Tools
- Python Pandas - IO Tools
- Python Pandas - Working with CSV Format
- Python Pandas - Reading & Writing JSON Files
- Python Pandas - Reading Data from an Excel File
- Python Pandas - Writing Data to Excel Files
- Python Pandas - Working with HTML Data
- Python Pandas - Clipboard
- Python Pandas - Working with HDF5 Format
- Python Pandas - Comparison with SQL
- Python Pandas - Data Handling
- Python Pandas - Sorting
- Python Pandas - Reindexing
- Python Pandas - Iteration
- Python Pandas - Concatenation
- Python Pandas - Statistical Functions
- Python Pandas - Descriptive Statistics
- Python Pandas - Working with Text Data
- Python Pandas - Function Application
- Python Pandas - Options & Customization
- Python Pandas - Window Functions
- Python Pandas - Aggregations
- Python Pandas - Merging/Joining
- Python Pandas - MultiIndex
- Python Pandas - Basics of MultiIndex
- Python Pandas - Indexing with MultiIndex
- Python Pandas - Advanced Reindexing with MultiIndex
- Python Pandas - Renaming MultiIndex Labels
- Python Pandas - Sorting a MultiIndex
- Python Pandas - Binary Operations
- Python Pandas - Binary Comparison Operations
- Python Pandas - Boolean Indexing
- Python Pandas - Boolean Masking
- Python Pandas - Data Reshaping & Pivoting
- Python Pandas - Pivoting
- Python Pandas - Stacking & Unstacking
- Python Pandas - Melting
- Python Pandas - Computing Dummy Variables
- Python Pandas - Categorical Data
- Python Pandas - Categorical Data
- Python Pandas - Ordering & Sorting Categorical Data
- Python Pandas - Comparing Categorical Data
- Python Pandas - Handling Missing Data
- Python Pandas - Missing Data
- Python Pandas - Filling Missing Data
- Python Pandas - Interpolation of Missing Values
- Python Pandas - Dropping Missing Data
- Python Pandas - Calculations with Missing Data
- Python Pandas - Handling Duplicates
- Python Pandas - Duplicated Data
- Python Pandas - Counting & Retrieving Unique Elements
- Python Pandas - Duplicated Labels
- Python Pandas - Grouping & Aggregation
- Python Pandas - GroupBy
- Python Pandas - Time-series Data
- Python Pandas - Date Functionality
- Python Pandas - Timedelta
- Python Pandas - Sparse Data Structures
- Python Pandas - Sparse Data
- Python Pandas - Visualization
- Python Pandas - Visualization
- Python Pandas - Additional Concepts
- Python Pandas - Caveats & Gotchas
Python Pandas - DataFrame
A DataFrame in Python's pandas library is a two-dimensional labeled data structure that is used for data manipulation and analysis. It can handle different data types such as integers, floats, and strings. Each column has a unique label, and each row is labeled with a unique index value, which helps in accessing specific rows.
DataFrame is used in machine learning tasks which allow the users to manipulate and analyze the data sets in large size. It supports the operations such as filtering, sorting, merging, grouping and transforming data.
Features of DataFrame
Following are the features of the Pandas DataFrame −
- Columns can be of different types.
- Size is mutable.
- Labeled axes (rows and columns).
- Can Perform Arithmetic operations on rows and columns.
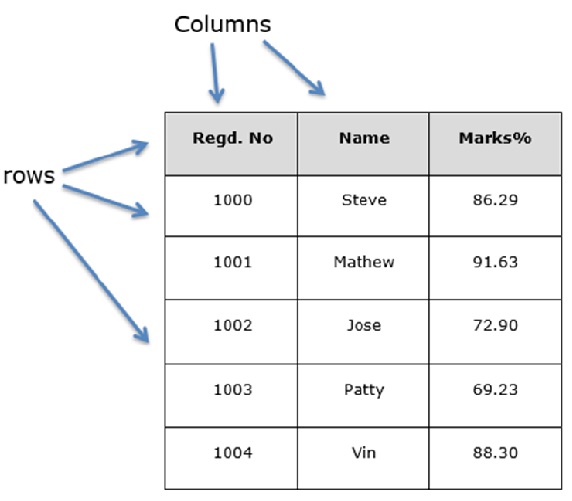
Python Pandas DataFrame Structure
You can think of a DataFrame as similar to an SQL table or a spreadsheet data representation. Let us assume that we are creating a data frame with student's data.
Creating a pandas DataFrame
A pandas DataFrame can be created using the following constructor −
pandas.DataFrame(data=None, index=None, columns=None, dtype=None, copy=None)
The parameters of the constructor are as follows −
| Sr.No | Parameter & Description |
|---|---|
| 1 |
data data takes various forms like ndarray, series, map, lists, dict, constants and also another DataFrame. |
| 2 |
index For the row labels, the Index to be used for the resulting frame is Optional Default np.arange(n) if no index is passed. |
| 3 |
columns This parameter specifies the column labels, the optional default syntax is - np.arange(n). This is only true if no index is passed. |
| 4 |
dtype Data type of each column. |
| 5 |
copy This command (or whatever it is) is used for copying of data, if the default is False. |
Creating a DataFrame from Different Inputs
A pandas DataFrame can be created using various inputs like −
- Lists
- Dictionary
- Series
- Numpy ndarrays
- Another DataFrame
- External input iles like CSV, JSON, HTML, Excel sheet, and more.
In the subsequent sections of this chapter, we will see how to create a DataFrame using these inputs.
Create an Empty DataFrame
An empty DataFrame can be created using the DataFrame constructor without any input.
Example
Following is the example creating an empty DataFrame.
#import the pandas library and aliasing as pd
import pandas as pd
df = pd.DataFrame()
print(df)
Its output is as follows −
Empty DataFrame
Columns: []
Index: []
Create a DataFrame from Lists
The DataFrame can be created using a single list or a list of lists.
Example
The following example demonstrates how to create a pandas DataFrame from a Python list object.
import pandas as pd
data = [1,2,3,4,5]
df = pd.DataFrame(data)
print(df)
Its output is as follows −
     0
0    1
1    2
2    3
3    4
4    5
Example
Here is another example of creating a Pandas DataFrame from the Python list of list.
import pandas as pd
data = [['Alex',10],['Bob',12],['Clarke',13]]
df = pd.DataFrame(data,columns=['Name','Age'])
print(df)
Its output is as follows −
      Name      Age
0     Alex      10
1     Bob       12
2     Clarke    13
Create a DataFrame from Dict of ndarrays / Lists
All the ndarrays must be of same length. If index is passed, then the length of the index should equal to the length of the arrays.
If no index is passed, then by default, index will be range(n), where n is the array length.
Example
Here is the example of creating the DataFrame from a Python dictionary.
import pandas as pd
data = {'Name':['Tom', 'Jack', 'Steve', 'Ricky'],'Age':[28,34,29,42]}
df = pd.DataFrame(data)
print(df)
Its output is as follows −
      Age      Name
0     28        Tom
1     34       Jack
2     29      Steve
3     42      Ricky
Note − Observe the values 0,1,2,3. They are the default index assigned to each using the function range(n).
Example
Let us now create an indexed DataFrame using arrays.
import pandas as pd
data = {'Name':['Tom', 'Jack', 'Steve', 'Ricky'],'Age':[28,34,29,42]}
df = pd.DataFrame(data, index=['rank1','rank2','rank3','rank4'])
print(df)
Its output is as follows −
         Age    Name
rank1    28      Tom
rank2    34     Jack
rank3    29    Steve
rank4    42    Ricky
Note − Observe, the index parameter assigns an index to each row.
Create a DataFrame from List of Dicts
List of Dictionaries can be passed as input data to create a DataFrame. The dictionary keys are by default taken as column names.
Example
The following example shows how to create a DataFrame by passing a list of dictionaries.
import pandas as pd
data = [{'a': 1, 'b': 2},{'a': 5, 'b': 10, 'c': 20}]
df = pd.DataFrame(data)
print(df)
Its output is as follows −
    a    b      c
0   1   2     NaN
1   5   10   20.0
Note − Observe, NaN (Not a Number) is appended in missing areas.
Example
The following example shows how to create a DataFrame with a list of dictionaries, row indices, and column indices.
import pandas as pd
data = [{'a': 1, 'b': 2},{'a': 5, 'b': 10, 'c': 20}]

#With two column indices, values same as dictionary keys
df1 = pd.DataFrame(data, index=['first', 'second'], columns=['a', 'b'])

#With two column indices with one index with other name
df2 = pd.DataFrame(data, index=['first', 'second'], columns=['a', 'b1'])
print(df1)
print(df2)
Its output is as follows −
#df1 output
         a  b
first    1  2
second   5  10

#df2 output
         a  b1
first    1  NaN
second   5  NaN
Note − Observe, df2 DataFrame is created with a column index other than the dictionary key; thus, appended the NaNs in place. Whereas, df1 is created with column indices same as dictionary keys, so NaNs appended.
Create a DataFrame from Dict of Series
Dictionary of Series can be passed to form a DataFrame. The resultant index is the union of all the series indexes passed.
Example
Here is the example −
import pandas as pd

d = {'one' : pd.Series([1, 2, 3], index=['a', 'b', 'c']),
   'two' : pd.Series([1, 2, 3, 4], index=['a', 'b', 'c', 'd'])}

df = pd.DataFrame(d)
print(df)
Its output is as follows −
      one    two
a     1.0    1
b     2.0    2
c     3.0    3
d     NaN    4
Note − Observe, for the series one, there is no label d passed, but in the result, for the d label, NaN is appended with NaN.
Example
Another example of creating a Pandas DataFrame from a Series −
import pandas as pd

data = pd.Series([1, 2, 3, 4], index=['a', 'b', 'c', 'd'])

df = pd.DataFrame(data)
print(df)
Its output is as follows −
       0
a      1
b      2
c      3
d      4