- Power BI - Home
- Power BI - Introduction
- Power BI - Installation Steps
- Power BI - Architecture
- Power BI Desktop
- Power BI - Desktop
- Power BI - Desktop Window
- Power BI Service
- Power BI - Window Supported Browsers
- Power BI - Generating Reports
- Power BI Desktop Service
- Power BI - Desktop vs Service
- Power BI - Supported Data Sources
- Power BI - Comparison Tools
- Power Query Editor
- Power Query Editor - Introduction
- Power Query Editor - Data Discrepancy
- Power Query Editor - Merge Queries (Part 1)
- Power Query Editor - Merge Queries (Part 2)
- Power BI - Develop Star Schema
- Data Modeling Concepts
- Power BI - Data Modeling
- Power BI - Manage Relationships
- Power BI - Cardinality
- Power BI - Dashboard Options
- Power BI Report Visualizations
- Power BI - Visualization Options
- Power BI - Visualization Charts
- Power BI - Stacked Bar Chart
- Power BI - Stacked Column Chart
- Power BI - Clustered Chart
- Power BI - 100% Stacked Chart
- Power BI - Area Chart and Stacked Area Chart
- Power BI - Line and Stacked Column Chart
- Power BI - Line and Clustered Column Chart
- Power BI - Ribbon Chart
- Power BI - Table and Matrix Visuals
- Power BI Map Visualizations
- Power BI - Creating Map Visualizations
- Power BI - ArcGIS Map
- Power BI Miscellaneous
- Power BI - Waterfall Charts
- Funnel Charts and Radial Gauge Chart
- Power BI - Scatter Chart
- Power BI - Pie Chart and Donut Chart
- Power BI - Card and Slicer Visualization
- Power BI - KPI Visual
- Power BI - Smart Narrative Visual
- Power BI - Decomposition Tree
- Power BI - Paginated Report
- Power BI - Python Script & R Script
- Power BI - Multi-row Card
- Power BI - Power Apps & Power Automate
- Power BI - Excel Integration
- Power BI Dashboard
- Power BI - Sharing Dashboards
- Power BI Sales Production Dashboard
- Power BI - HR Analytics Dashboard
- Power BI - Customer Analytics Dashboard
- Power BI - DAX Basics
- Power BI - Administration Role
- Power BI - DAX Functions
- Power BI - DAX Text Functions
- Power BI - DAX Date Functions
- Power BI - DAX Logical Functions
- Power BI - DAX Counting Functions
- Power BI - Depreciation Functions
- Power BI - DAX Information Functions
Power BI - Generating Reports
Create a Report in a Power BI Service
Making reports in a Power BI service is similar to report generation in a Power BI desktop. Before creating the report, you must either upload the file or construct the table. The various options like Paginated Report, create a report, and auto-generate report are facilitated in the Power BI service.
Auto Create Report
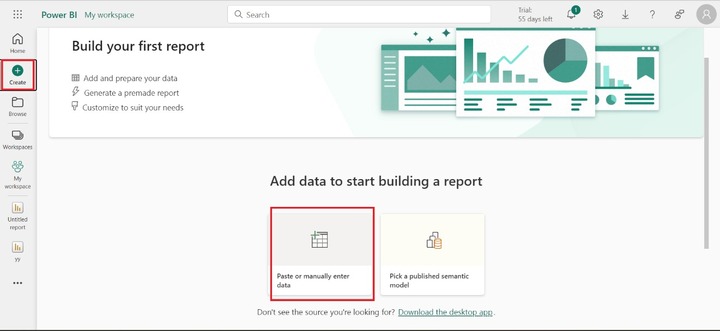
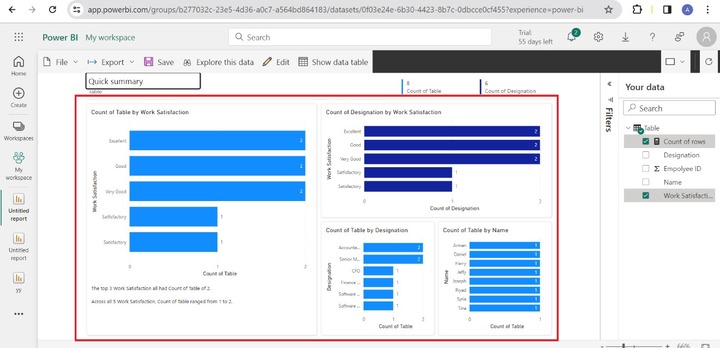
Richard is not familiar with the Power BI service; the first time he is trying to develop a new report. He logged in to the Power BI service and clicked on "Create" from the left pane and selected "Paste or manually enter data".
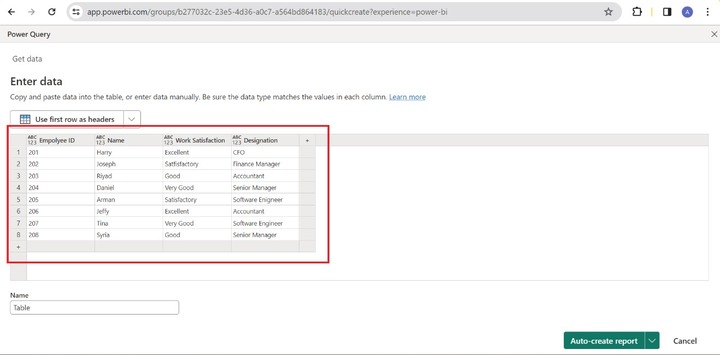
Richard entered the data manually and selected the "Use first row as headers" and clicked on the "Auto-create report".
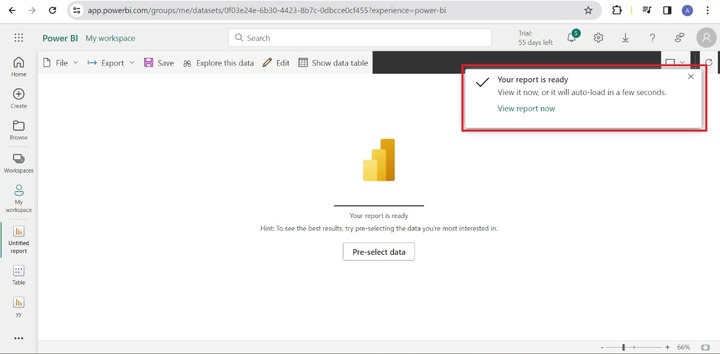
The prompt "Your report is ready" will appear. He can click on the "View report now".
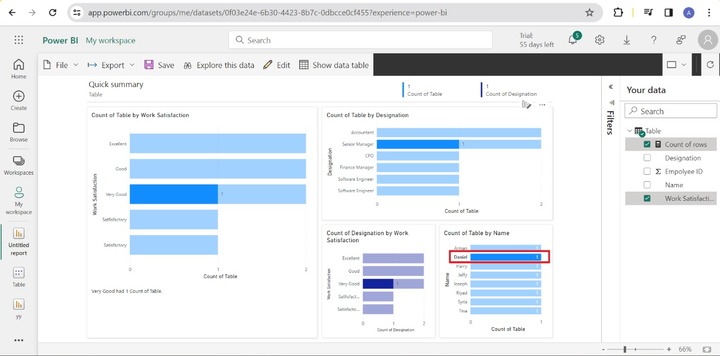
Finally, the stunning report is automatically generated. Richard can also navigate between these charts on a single report. For example, He gets to know the designation and work satisfaction of "Daniel".
Once he clicks on "Daniel", his designation and work satisfaction are populated on the report. By observing the screenshot, Daniel was designated as a senior manager and work satisfaction is "Very Good". Similarly, he can identify the work satisfaction and designation of other employees.
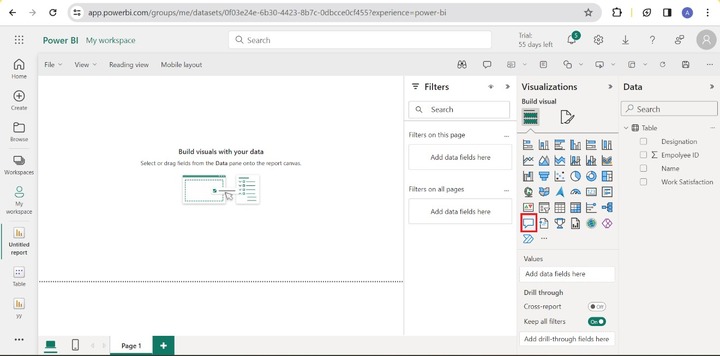
How to Create a Report from Scratch?
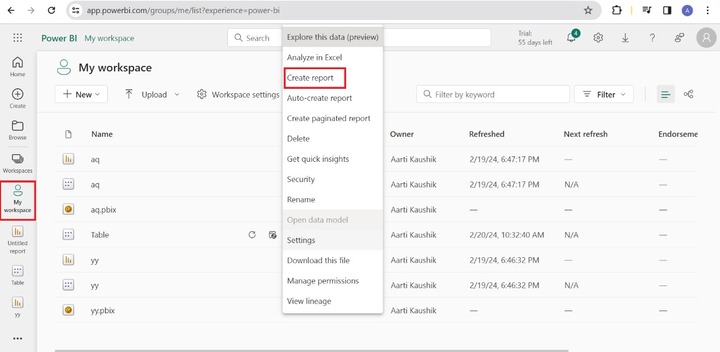
Richard got to know how to quickly summarize the data by utilizing auto-generating reports. Now, he wants to create a report from scratch. Click on the "My workspace" and select the "Create report".
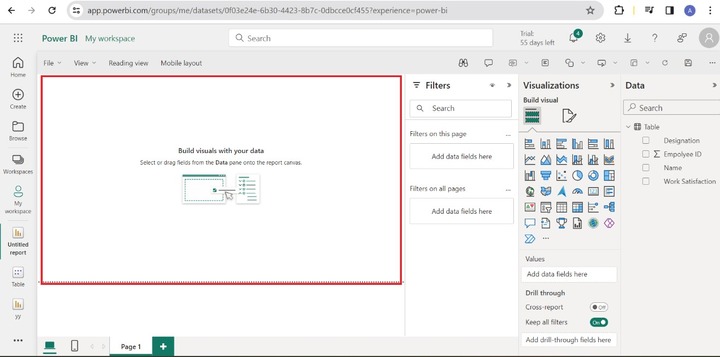
Add Fields to Report
He can select the "Stacked bar chart" visual and add the Designation field to the Y-axis and the "Work Satisfaction" field to the X-axis. Therefore, the stacked bar chart shows the count of work satisfaction by the employees designation.
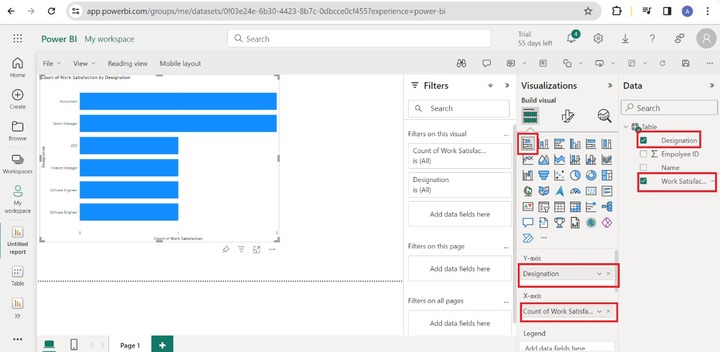
Now, he can save this report and share it with colleagues within the current organization.
Q&A in Power BI Service
You can choose the Q&A visual to ask questions and get to know about the dataset.
Following are the sample questions that you can get the answers in the Q&A visual.
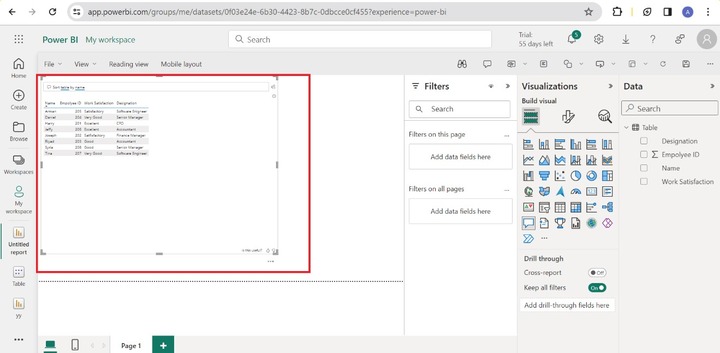
Question 1 - Sort Table by Name
Once you write the question in the Q&A textbox, the sorted table by name is displayed on the canvas.
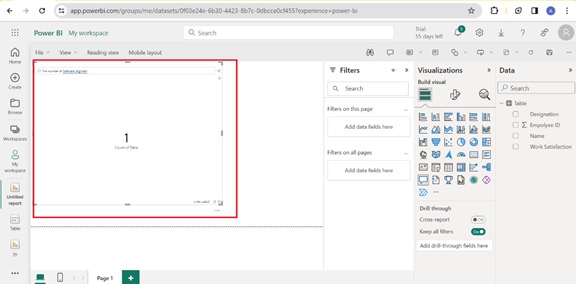
Question 2 - The Number of Software Engineer
When you write this question, there is only one software engineer in a table.
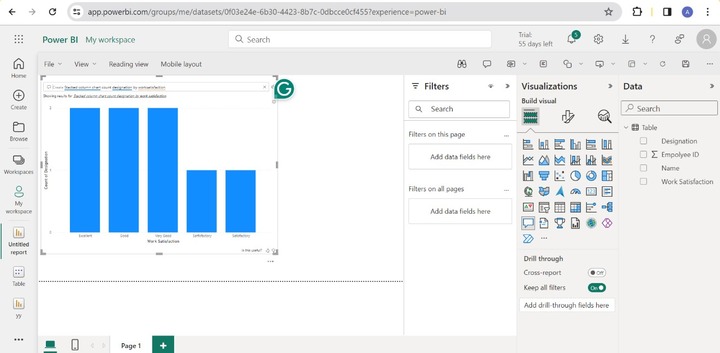
Question 3 - Create a Stacked column chart count designation by work satisfaction.
When you enter this question in the "Q&A" textbox, the stacked column chart will be populated on the canvas.
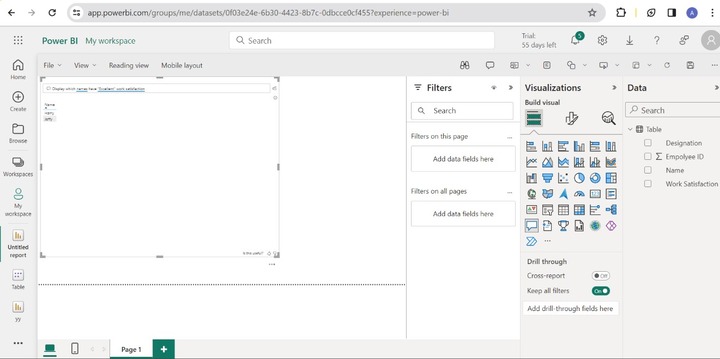
Question 4 - Display which names have "Excellent" work satisfaction.
You can observe in the screenshot, that the name of the employees are populated on the screen.
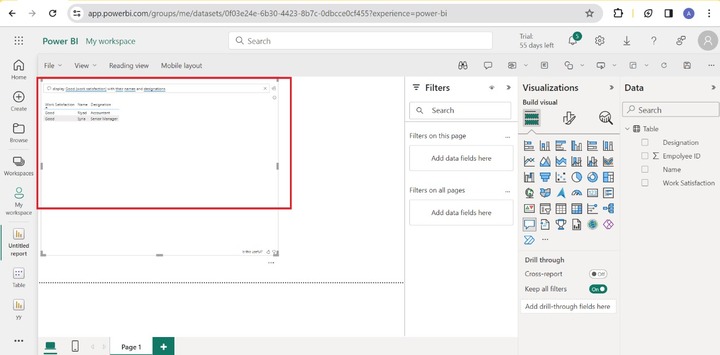
Question 5 - Display Good (work satisfaction) with their names and designations.
As you would observe in the screenshot, the name, designation, and work satisfaction of those employees populated whose work satisfaction is "good".
Publishing Report from Power BI Desktop in Power BI Service
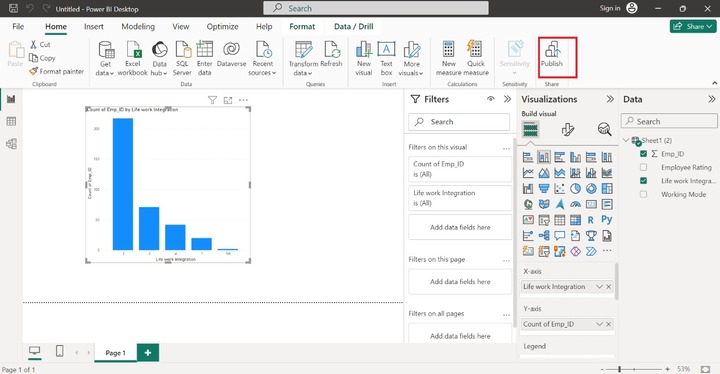
Designers work on the Power BI desktop where they can create eye-catching beautiful reports. If you want to share reports with other teams within organizations. Firstly, open the Power BI Desktop and load the sample dataset from the local system. Assume that the sample report as you can notice in the screenshot.
Save the report before clicking on the "Publish".
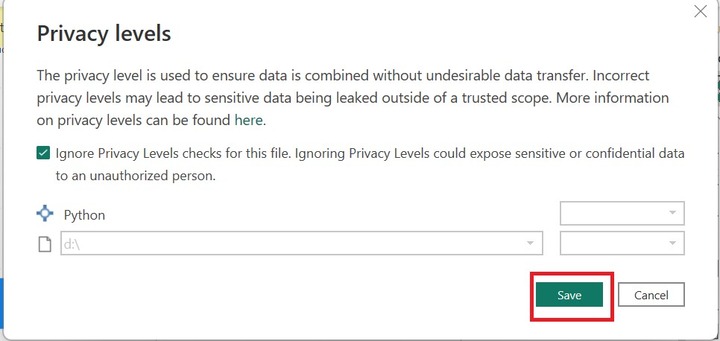
The prompt of Privacy levels is displayed, read it carefully tick on the checkbox, and click on Save.
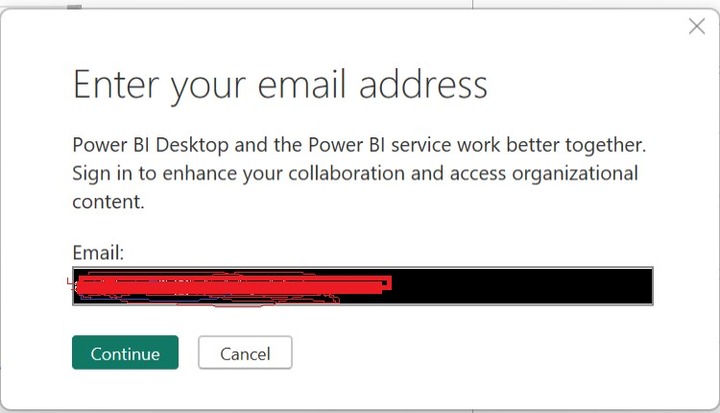
You can enter the valid email ID and click on the Continue.
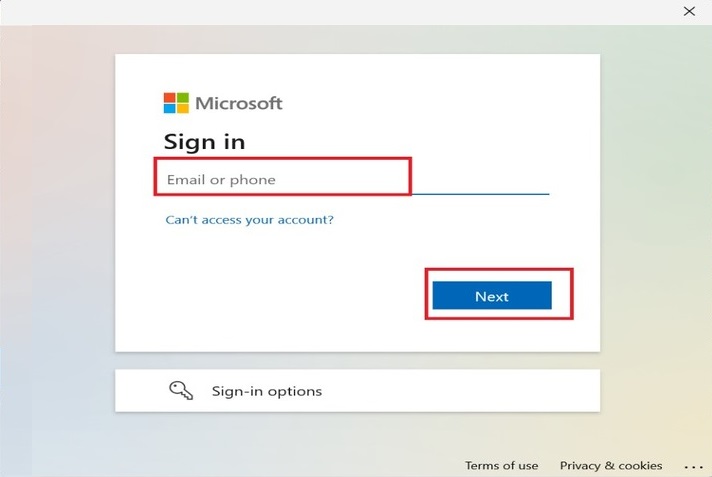
Another dialog box will open where you can write your official email ID and click on Next.
Enter a valid password to Sign in to your Microsoft account. If you forgot your password, then click on the "Forgot my password" to reset your password again. You may encounter difficulties in signing if your username and password are incorrect.
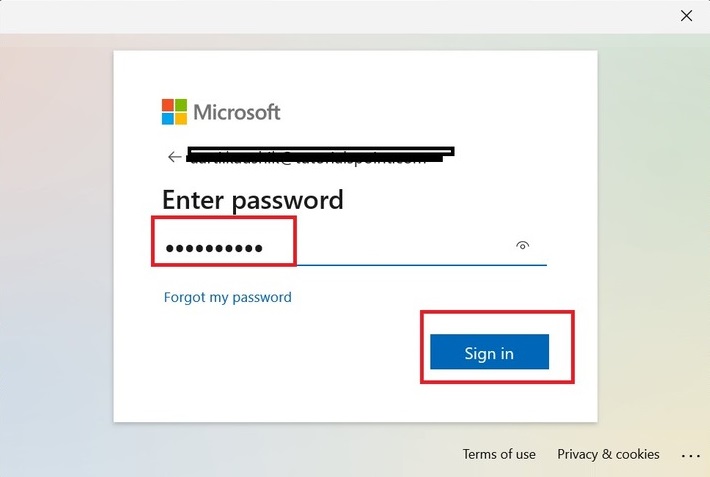
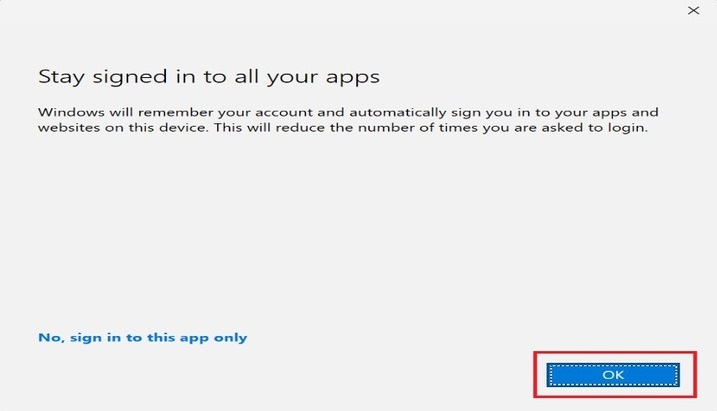
You can click on the OK in the "Stay signed in to all your apps" dialog box.
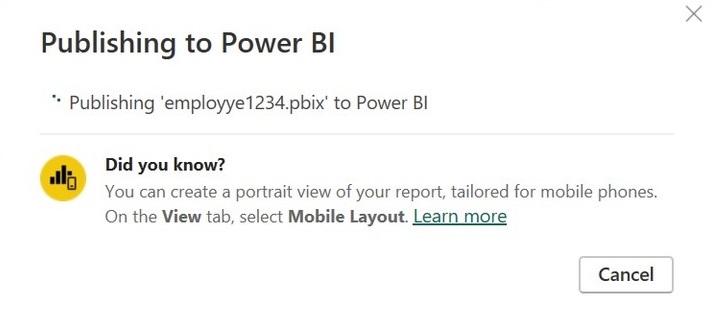
The prompt will appear that shows the message "Publishing to Power BI" which takes a few seconds for further messages.
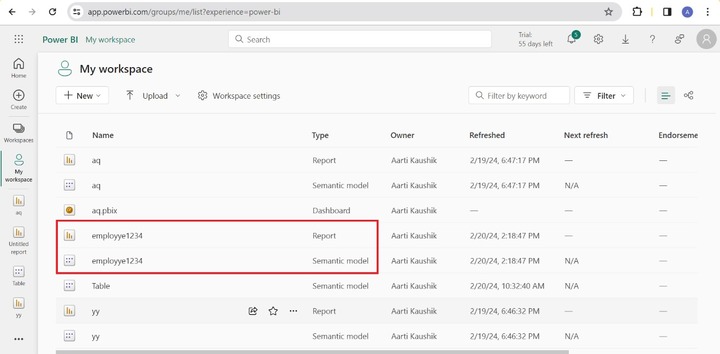
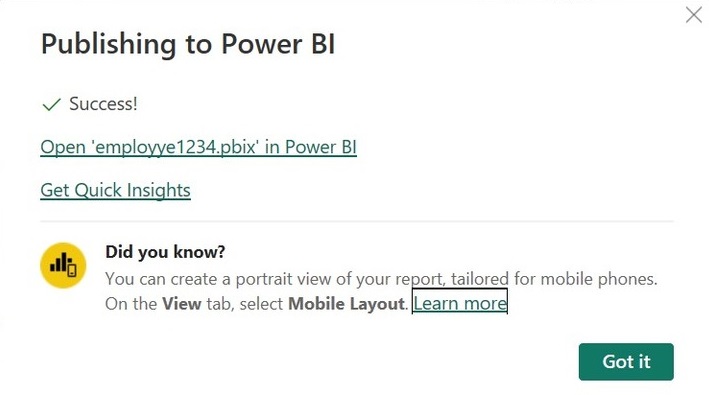
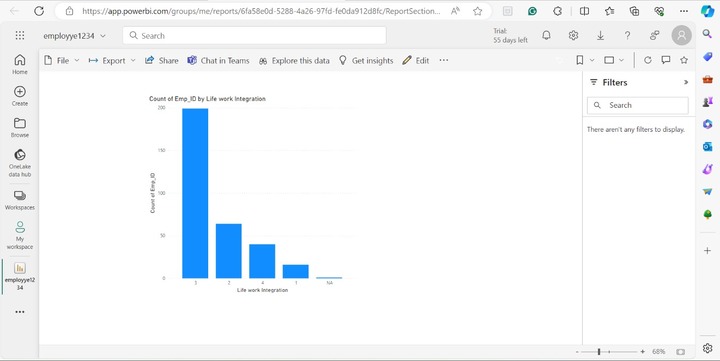
As you can observe in the screenshot, the report has been published to the Power BI service. Now, you can swiftly take a close-up of the report in the Power BI service and get Quick Insights into it. Click on the link Open employye1234.pbix in Power BI.
And finally, the report is shown in the Power BI service.
Click on "My Workspace" where you can observe that the report and semantic model of "employye1234" are saved in this respective location.