
Article Categories
- All Categories
-
 Data Structure
-
 Networking
-
 RDBMS
RDBMS
-
 Operating System
-
 Java
Java
-
 MS Excel
-
 iOS
iOS
-
 HTML
HTML
-
 CSS
CSS
-
 Android
-
 Python
-
 C Programming
-
 C++
C++
-
 C#
C#
-
 MongoDB
-
 MySQL
MySQL
-
 Javascript
-
 PHP
PHP
Selected Reading
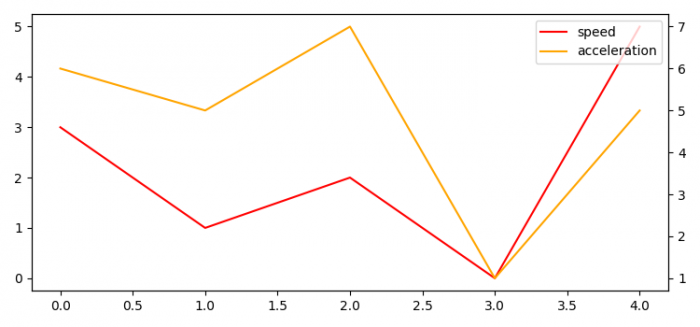
How to plot single data with two Y-axes (two units) in Matplotlib?
To plot single data with two Y-Axes (Two units) in Matplotlib, we can take the following steps −
- Set the figure size and adjust the padding between and around the subplots.
- Create speed and acceleration data points using numpy.
- Add a subplot to the current figure.
- Plot speed data points using plot() method.
- Create a twin Axes sharing the X-axis.
- Plot acceleration data point using plot() method.
- Place a legend on the figure.
- To display the figure, use show() method.
Example
import matplotlib.pyplot as plt
import numpy as np

plt.rcParams["figure.figsize"] = [7.50, 3.50]
plt.rcParams["figure.autolayout"] = True

speed = np.array([3, 1, 2, 0, 5])
acceleration = np.array([6, 5, 7, 1, 5])

ax1 = plt.subplot()
l1, = ax1.plot(speed, color='red')
ax2 = ax1.twinx()
l2, = ax2.plot(acceleration, color='orange')

plt.legend([l1, l2], ["speed", "acceleration"])

plt.show()
Output

Updated on: 2021-06-10T12:02:03+05:30
10K+ Views

Advertisements