- Facebook Marketing - Home
- Facebook Marketing - Overview
- Profile Page Setup
- Page Navigation
- Facebook Marketing - Ad Options
- Ad Management
- Page Promotion
- Personal Branding
- Facebook Marketing - Identify Targets
- Facebook Marketing - Quality Posts
- Facebook Marketing - Post Frequency
- Likes Philosophy
- Facebook Marketing - Create Fans
- Facebook Marketing - Engaging Fans
- Facebook Marketing - Call-to-Action
- Video Promotion
- Marketing Tricks
- Facebook Marketing - A/B Testing
- Facebook Marketing - Analytics
Facebook Marketing - Analytics
Facebook analytics, also known as insights, provide you with very important statistical analysis of how your campaigns are going and what sort of engagement your posts are receiving.
Following is an image of the front page of the analytics section. It gives you an insight if your audience is large enough. In addition, it also helps you know the types of devices your audience uses and you can also have a track of the page/video views.
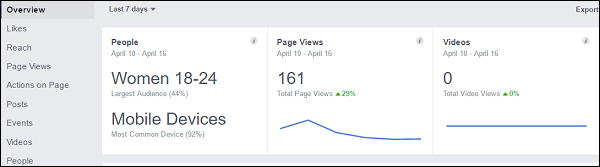
On the right hand side, there is a toolbar with the different sections that you can go through to find various insights. We will go through each area on what information you can get from them.
Likes
In this section, you will be able to see the total likes for your page. It will give you a graph with a 30-day overview and you can see how to track your progress. You will also be able to view your net likes, which shows how many likes you get for each day as well as how many unlikes your page is getting each day.
Finally, you can see where your likes are coming from from people coming on your page and clicking like, finding you through ads and through the API.
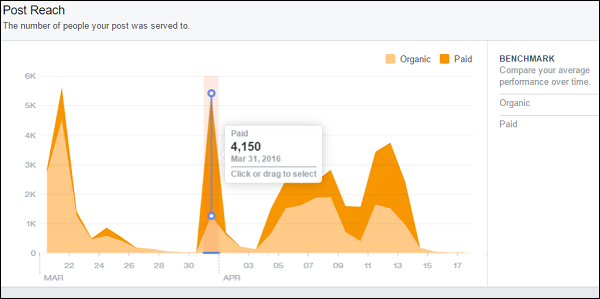
Reach
This indicates how many people see your post. As seen in the following graph, it is separated with organic reach and paid reach. In this section, you can also find the graph for reactions and shares for all posts.
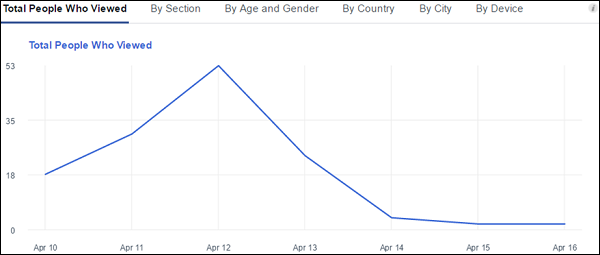
Page views
This gives you an insight into how many people are viewing your page on a day-to-day basis. This is great because, especially in the early days when you are testing different post types, you can see the analytics over a period of time and see which days are working better to get click through on to your page.
The following first graph shows you total views for each day, while the second graph gives you the ability to break it down by total page views, by section, age and gender, country, city and by device.
Actions on page
Page actions tell you what people are clicking on whilst they are looking at your page. Here you can see which people are clicking −
- Directions
- Phone numbers
- Website clicks
- Page call-to-action button
This is also broken down by the same insights as the page views (age and gender, country, city and by device).
Posts
This insight is great because it shows some important information. This brings you clear data sets and shows when your fans were online over the last 7-day period.
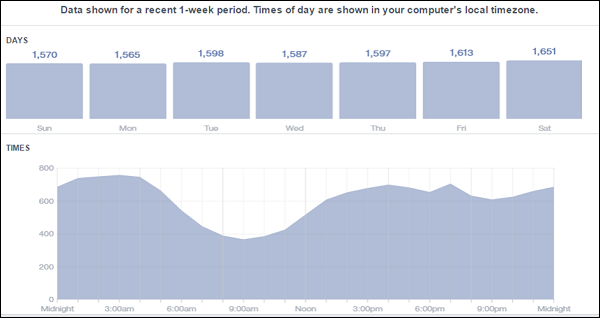
Underneath the graph of when your fans are online, you will see a list of all the posts you have made for your page. This breaks down all your posts and tells you how much engagement each post has had. It also gives you data on how much reach each post has received. There is a button to boost posts and to see the results of previously boosted posts.
Events
The events insight gives you statistical data on how much awareness your event has received. It also gives you information on the audience/demographic that are attending the event, how much engagement the event has received and if you have a buy tickets button, it will tell you how many people have clicked the link.
Videos
This insight is very similar to the posts insight. It breaks down how your video reach has gone for each video and a breakdown of the demographics.
People
This is a very important insight as you get a complete breakdown on the age and gender of your Facebook fans. You also get a breakdown of which countries your fans are from, the cities within the countries and the language your fans speak.
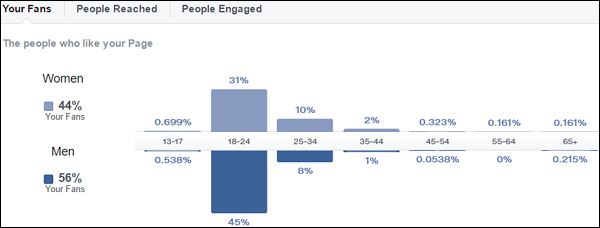
This helps with future campaigns as by now you have an idea of who is using your page.