- Bugzilla - Home
- Bugzilla - Overview
- Installation Prerequisites
- Bugzilla - Installation
- Bugzilla - Sample Web Application
- New Account Creation
- Bugzilla - Login
- Bugzilla - Logging a New Bug
- Bugzilla - Clone a Bug
- Bugzilla - Understanding a Bug
- Bugzilla - Editing a Bug
- Bugzilla - Reports
- Bugzilla - Graphical Reports
- Bugzilla - Tabular Reports
- Bugzilla - Duplicate
- Bugzilla - Browse Function
- Bugzilla - Simple Search
- Bugzilla - Quick Search
- Bugzilla - Advance Search
- Bugzilla - Custom Search
- Bugzilla - Bug Lists
- Bugzilla - Preferences
- Bugzilla - General Preferences
- Bugzilla - Email Preferences
- Bugzilla - Saved Searches
- Bugzilla - Account Information
- Bugzilla - Permissions
Bugzilla - Reports
A report helps to analyse the current state of the bug. The purpose of a Defect Report is to see the behaviour, communication, analysis and the current stage of a defect at any stage of the defect lifecycle. Defect reports are even useful after closing the defect and analysis the product and development quality.
Following are some of the important points to consider regarding the various Bugzilla reports.
Bugzilla supports those Tabular Reports that have HTML or CSV reports.
Tabular reports can be viewed in 1-Dimensional, 2-Dimensional or 3-Dimensional ways.
The most common type of report supported by Bugzilla are the Graphical Reports.
Graphical Reports contain line graph, bar and pie charts.
Report functionality is based on Search and filter concept, for which the conditions are given by users.
The user provides his preference of vertical and horizontal axis to plot graphs, charts or tables along with filter criterias like Project, Component, Defect Status, etc.
The user can even choose 3-D reports for tables and images.
Navigating the Reports Section
For navigating the reports section in Bugzilla, we should follow the steps given below.
Step 1 − Click on the Reports link in the header of the homepage.
Step 2 − Bugzilla displays the Reporting and Charting Kitchen page. It has two sections to generate different type of reports Tabular Reports and Graphical Reports.
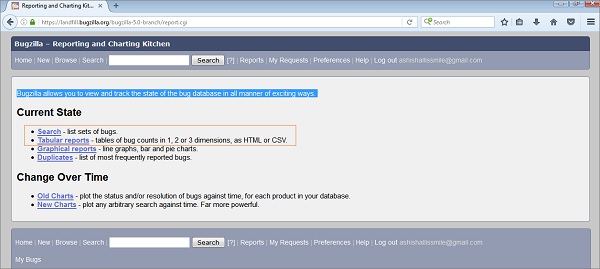
Other links like −
Search − It will navigate the user to the standard search page.
Duplicate − It will display the most frequently reported bugs.
In the next chapter, we will understand what graphical reports are and how to generate them.