- Bokeh - Home
- Bokeh - Introduction
- Bokeh - Environment Setup
- Bokeh - Getting Started
- Bokeh - Jupyter Notebook
- Bokeh - Basic Concepts
- Bokeh - Plots with Glyphs
- Bokeh - Area Plots
- Bokeh - Circle Glyphs
- Bokeh - Rectangle, Oval and Polygon
- Bokeh - Wedges and Arcs
- Bokeh - Specialized Curves
- Bokeh - Setting Ranges
- Bokeh - Axes
- Bokeh - Annotations and Legends
- Bokeh - Pandas
- Bokeh - ColumnDataSource
- Bokeh - Filtering Data
- Bokeh - Layouts
- Bokeh - Plot Tools
- Bokeh - Styling Visual Attributes
- Bokeh - Customising legends
- Bokeh - Adding Widgets
- Bokeh - Server
- Bokeh - Using Bokeh Subcommands
- Bokeh - Exporting Plots
- Bokeh - Embedding Plots and Apps
- Bokeh - Extending Bokeh
- Bokeh - WebGL
- Bokeh - Developing with JavaScript
Bokeh Resources
Bokeh - Area Plots
Area plots are filled regions between two series that share a common index. Bokeh's Figure class has two methods as follows −
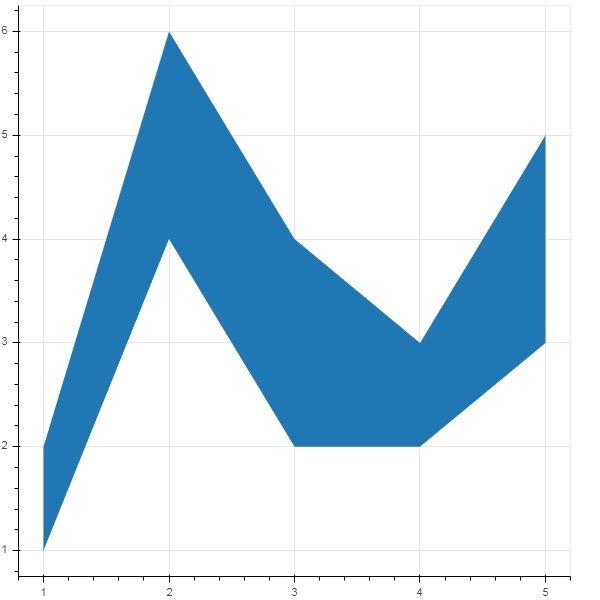
varea()
Output of the varea() method is a vertical directed area that has one x coordinate array, and two y coordinate arrays, y1 and y2, which will be filled between.
| 1 | x | The x-coordinates for the points of the area. |
| 2 | y1 | The y-coordinates for the points of one side of the area. |
| 3 | y2 | The y-coordinates for the points of the other side of the area. |
Example - Vertical Directed Area Plot
main.py
from bokeh.plotting import figure, output_file, show

fig = figure()
x = [1, 2, 3, 4, 5]
y1 = [2, 6, 4, 3, 5]
y2 = [1, 4, 2, 2, 3]
fig.varea(x = x,y1 = y1,y2 = y2)

output_file('area.html')
show(fig)
Output
Run the code and verify the output in the browser.
(myenv) D:\bokeh\myenv>py main.py
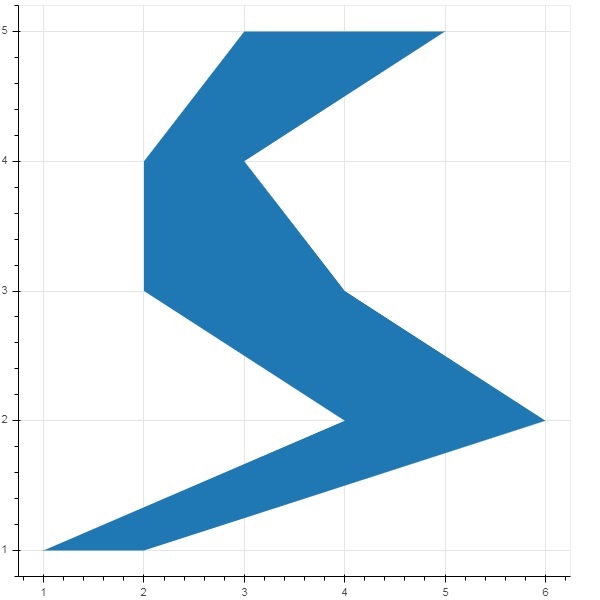
harea()
The harea() method on the other hand needs x1, x2 and y parameters.
| 1 | x1 | The x-coordinates for the points of one side of the area. |
| 2 | x2 | The x-coordinates for the points of the other side of the area. |
| 3 | y | The y-coordinates for the points of the area. |
Example - Horizontal Directed Area Plot
main.py
from bokeh.plotting import figure, output_file, show

fig = figure()
y = [1, 2, 3, 4, 5]
x1 = [2, 6, 4, 3, 5]
x2 = [1, 4, 2, 2, 3]
fig.harea(x1 = x1,x2 = x2,y = y)

output_file('area.html')
show(fig)
Output
Run the code and verify the output in the browser.
(myenv) D:\bokeh\myenv>py main.py
Advertisements