- Angular Google Charts - Home
- Angular Google Charts - Overview
- Angular Google Charts - Environment Setup
- Angular Google Charts - Configuration Syntax
- Angular Google Charts - Area Charts
- Angular Google Charts - Bar Charts
- Angular Google Charts - Bubble Charts
- Angular Google Charts - Candlestick
- Angular Google Charts - Column Charts
- Angular Google Charts - Combination
- Angular Google Charts - Histogram
- Angular Google Charts - Line Charts
- Angular Google Charts - Maps
- Angular Google Charts - Organization
- Angular Google Charts - Pie Charts
- Angular Google Charts - Sankey Charts
- Angular Google Charts - Scatter Chart
- Angular Google Charts - Stepped Area Charts
- Angular Google Charts - Table Chart
- Angular Google Charts - TreeMap Chart
Angular Google Charts Resources
Angular Google Charts - Organization Chart
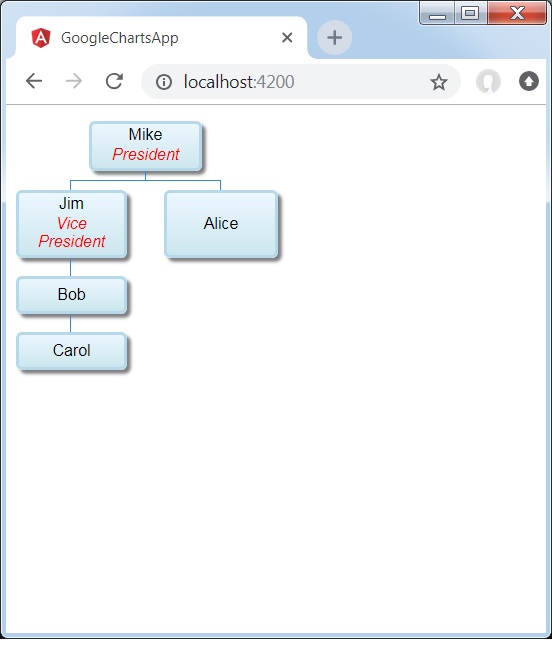
Organization chart helps in rendering a hierarchy of nodes, used to portray superior/subordinate relationships in an organization. For example, A family tree is a type of org chart. Following is an example of an Organization Chart.
We have already seen the configurations used to draw a chart in Google Charts Configuration Syntax chapter. Now, let us see an example of an Organization Chart.
Configurations
We've used OrgChart value to show Line based chart.
type = ChartType.OrgChart;
Example - Usage of Organization Chart
app.ts
import { Component, signal } from '@angular/core';
import { ChartType, GoogleChart } from 'angular-google-charts';

@Component({
   selector: 'app-root',
   imports: [GoogleChart],
   templateUrl: './app.html',
   styleUrl: './app.css'
})
export class App {
   protected readonly title = signal('google-charts-app');
   type = ChartType.OrgChart;
   data = [
      [{v:'Mike', f:'Mike<div style="color:red; font-style:italic">President</div>'},
         '', 'The President'],
      [{v:'Jim', f:'Jim<div style="color:red; font-style:italic">Vice President</div>'},
         'Mike', 'VP'],
      ['Alice', 'Mike', ''],
      ['Bob', 'Jim', 'Bob Sponge'],
      ['Carol', 'Bob', '']
   ];
   columnNames = ["Name","Manager","Tooltip"];
   options = {
       allowHtml: true
   };
   width = 550;
   height = 400;
}
Result
Verify the result.
Advertisements