
Article Categories
- All Categories
-
 Data Structure
-
 Networking
-
 RDBMS
RDBMS
-
 Operating System
-
 Java
Java
-
 MS Excel
-
 iOS
iOS
-
 HTML
HTML
-
 CSS
CSS
-
 Android
-
 Python
-
 C Programming
-
 C++
C++
-
 C#
C#
-
 MongoDB
-
 MySQL
MySQL
-
 Javascript
-
 PHP
PHP
-
 Economics & Finance
Selected Reading
What is the necessity of plt.figure() in Matplotlib?
Using plt.figure(), we can create multiple figures and to close them all explicitly, call plt.close(). If you are creating many figures, make sure you explicitly call pyplot.close on the figures you are not using, because this will enable pyplot to properly clean up the memory.
Using subplots(), we can create a figure and set of subplots.
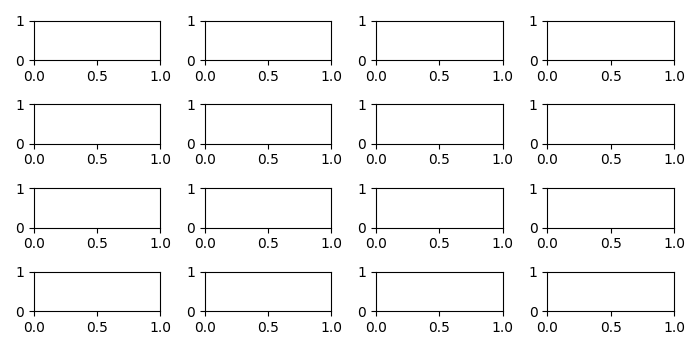
Here we creating two figures, fig1 and fig2. fig1 is 8×8 in size, whereas fig2 has the default figsize. There are 4×4=16 subplots added in fig2.
Example
from matplotlib import pyplot as plt
plt.rcParams["figure.figsize"] = [7.00, 3.50]
plt.rcParams["figure.autolayout"] = True
fig2, ax_lst = plt.subplots(4, 4)
plt.show()
Output

Updated on: 2021-05-08T09:25:30+05:30
395 Views

Advertisements