
 Data Structure
 Networking
 RDBMS
RDBMS Operating System
 Java
Java MS Excel
 iOS
iOS HTML
HTML CSS
CSS Android
 Python
 C Programming
 C++
C++ C#
C# MongoDB
 MySQL
MySQL Javascript
 PHP
PHP
- Selected Reading
- UPSC IAS Exams Notes
- Developer's Best Practices
- Questions and Answers
- Effective Resume Writing
- HR Interview Questions
- Computer Glossary
- Who is Who
What exactly is a Matplotlib axes object?
The Axes class contains most of the figure elements − Axis, Tick, Line2D, Text, Polygon, etc., and sets the coordinate system.
steps
Set the figure size and adjust the padding between and around the subplots.
Set the axes linewidth using rcParams.
Add an axes to the current figure and make it the current axes.
Set the axes spines color.
To display the figure, use show() method.
Example
from matplotlib import pyplot as plt
plt.rcParams["figure.figsize"] = [7.50, 3.50]
plt.rcParams["figure.autolayout"] = True
plt.rcParams['axes.linewidth'] = 5
ax = plt.axes()
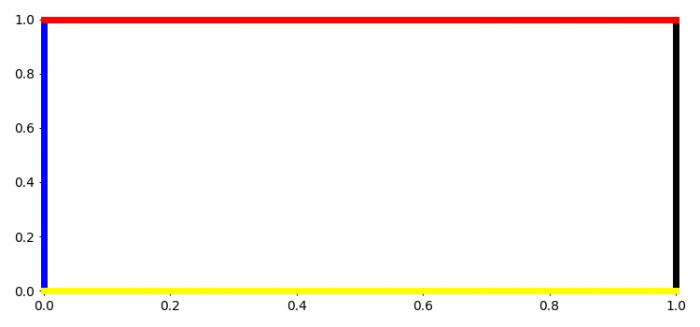
ax.spines['bottom'].set_color('yellow')
ax.spines['top'].set_color('red')
ax.spines['right'].set_color('black')
ax.spines['left'].set_color('blue')
plt.show()
Output

Updated on: 2021-08-10T07:18:18+05:30
439 Views

Advertisements