
 Data Structure
 Networking
 RDBMS
RDBMS Operating System
 Java
Java MS Excel
 iOS
iOS HTML
HTML CSS
CSS Android
 Python
 C Programming
 C++
C++ C#
C# MongoDB
 MySQL
MySQL Javascript
 PHP
PHP
- Selected Reading
- UPSC IAS Exams Notes
- Developer's Best Practices
- Questions and Answers
- Effective Resume Writing
- HR Interview Questions
- Computer Glossary
- Who is Who
What does axes.flat in Matplotlib do?
Axes.flat means a 1D iterator over the array. Let's take an example to see how to use axes.flat.
Steps
Set the figure size and adjust the padding between and around the subplots.
Create a figure and a set of subplots using subplots() method.
Create x and y data points using numpy.
Use axes.flat and iterate all the axes (step 2).
Plot x and y data points using plot() method.
To display the figure, use show() method.
Example
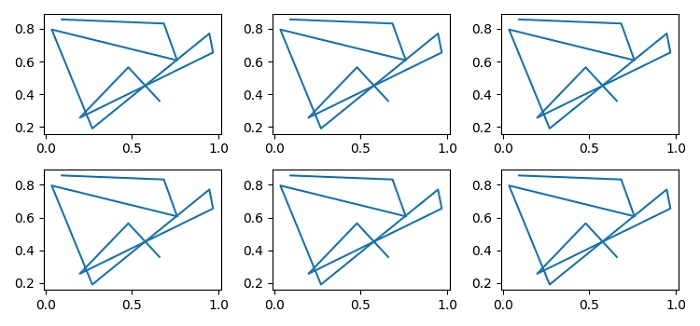
import numpy as np
from matplotlib import pyplot as plt

plt.rcParams["figure.figsize"] = [7.50, 3.50]
plt.rcParams["figure.autolayout"] = True
fig, axes = plt.subplots(nrows=2, ncols=3)
x = np.random.rand(10)
y = np.random.rand(10)
for _, ax in enumerate(axes.flat):
   ax.plot(x, y)
plt.show()
Output

Updated on: 2021-06-01T11:47:53+05:30
5K+ Views

Advertisements