
Article Categories
- All Categories
-
 Data Structure
-
 Networking
-
 RDBMS
RDBMS
-
 Operating System
-
 Java
Java
-
 MS Excel
-
 iOS
iOS
-
 HTML
HTML
-
 CSS
CSS
-
 Android
-
 Python
-
 C Programming
-
 C++
C++
-
 C#
C#
-
 MongoDB
-
 MySQL
MySQL
-
 Javascript
-
 PHP
PHP
-
 Economics & Finance
Selected Reading
What are n, bins and patches in matplotlib?
The hist() method returns n, bins and patches in matplotlib. Patches are the containers of individual artists used to create the histogram or list of such containers if there are multiple input datasets. Bins define the number of equal-width bins in the range.
Let's take an example to understand how it works.
steps
Set the figure size and adjust the padding between and around the subplots.
Create random data points using numpy.
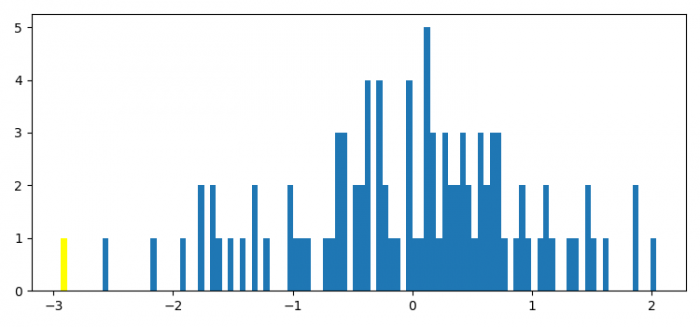
Make a Hist plot with 100 bins.
Set a property on an artist object.
To display the figure, use show() method.
Example
import numpy as np
import matplotlib.pyplot as plt

plt.rcParams["figure.figsize"] = [7.50, 3.50]
plt.rcParams["figure.autolayout"] = True

x = np.random.normal(size=100)

n, bins, patches = plt.hist(x, bins=100)

plt.setp(patches[0], 'facecolor', 'yellow')

plt.show()
Output

Updated on: 2021-08-09T07:32:56+05:30
2K+ Views

Advertisements