
 Data Structure
 Networking
 RDBMS
RDBMS Operating System
 Java
Java MS Excel
 iOS
iOS HTML
HTML CSS
CSS Android
 Python
 C Programming
 C++
C++ C#
C# MongoDB
 MySQL
MySQL Javascript
 PHP
PHP
- Selected Reading
- UPSC IAS Exams Notes
- Developer's Best Practices
- Questions and Answers
- Effective Resume Writing
- HR Interview Questions
- Computer Glossary
- Who is Who
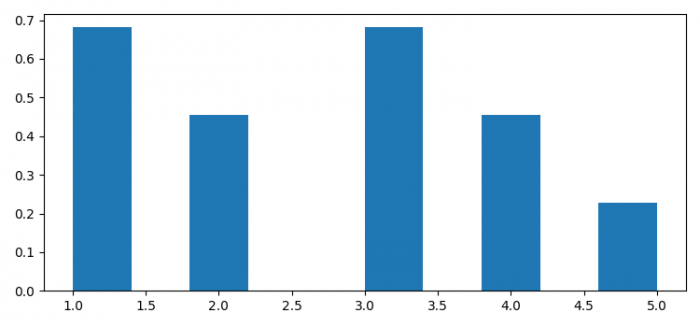
Vertical Histogram in Python and Matplotlib
To plot vertical histogram in Python and Matplotlib, we can take the following steps −
- Set the figure size and adjust the padding between and around the subplots.
- Create a list of data points.
- Plot a histogram with vertical orientation.
- To display the figure, use show() method.
Example
import matplotlib.pyplot as plt

plt.rcParams["figure.figsize"] = [7.50, 3.50]
plt.rcParams["figure.autolayout"] = True

x = [1, 2, 3, 1, 2, 3, 4, 1, 3, 4, 5]

plt.hist(x, orientation="vertical")

plt.show()
Output

Updated on: 2021-06-16T12:13:32+05:30
1K+ Views

Advertisements