
 Data Structure
 Networking
 RDBMS
RDBMS Operating System
 Java
Java MS Excel
 iOS
iOS HTML
HTML CSS
CSS Android
 Python
 C Programming
 C++
C++ C#
C# MongoDB
 MySQL
MySQL Javascript
 PHP
PHP
- Selected Reading
- UPSC IAS Exams Notes
- Developer's Best Practices
- Questions and Answers
- Effective Resume Writing
- HR Interview Questions
- Computer Glossary
- Who is Who
Stuffing a Pandas DataFrame.plot into a Matplotlib subplot
To stuff a Pandas dataframe plot into a Matplotlib subplot, we can take the following steps −
- Set the figure size and adjust the padding between and around the subplots.
- Create a figure and a set of subplots, two axes.
- Create a Pandas dataframe using DataFrame.
- Use DataFrame.plot() method to plot.
- To display the figure, use show() method.
Example
import pandas as pd
import matplotlib.pyplot as plt
plt.rcParams["figure.figsize"] = [7.50, 3.50]
plt.rcParams["figure.autolayout"] = True
fig, (ax1, ax2) = plt.subplots(2)
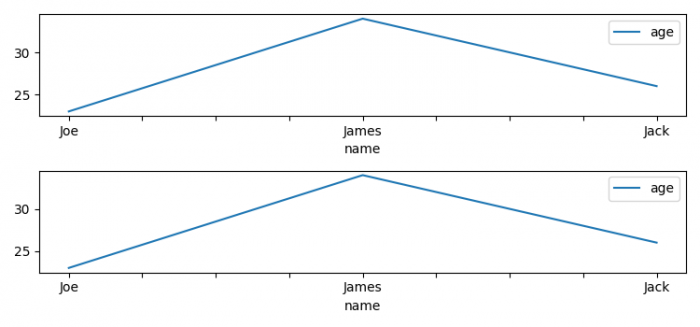
df = pd.DataFrame(dict(name=["Joe", "James", "Jack"], age=[23, 34, 26]))
df.set_index("name").plot(ax=ax1)
df.set_index("name").plot(ax=ax2)
plt.show()
Output

Updated on: 2021-06-10T11:47:56+05:30
2K+ Views

Advertisements