
 Data Structure
 Networking
 RDBMS
RDBMS Operating System
 Java
Java MS Excel
 iOS
iOS HTML
HTML CSS
CSS Android
 Python
 C Programming
 C++
C++ C#
C# MongoDB
 MySQL
MySQL Javascript
 PHP
PHP
- Selected Reading
- UPSC IAS Exams Notes
- Developer's Best Practices
- Questions and Answers
- Effective Resume Writing
- HR Interview Questions
- Computer Glossary
- Who is Who
Stock Trends Candlestick Patterns
Even though stock trading might appear daunting, particularly for novice investors, investing the time to learn can help you grasp the fundamental ideas.
In order together to purchase or sell certain stocks, investors must use data. Charts, where recognizable forms or patterns might emerge, are frequently used to convey data.
Stock Price Prediction with Machine Learning assists you in determining the future worth of business stock and other financial assets traded on an exchange. The whole point of forecasting stock values is to make big money. It is difficult to forecast how the stock market will fare. Other aspects, such as physical and psychological characteristics, rational and illogical conduct, and so on, are involved in the forecast.
In this article, Candlestick Patterns is one of those patterns
Describe the candlestick pattern.
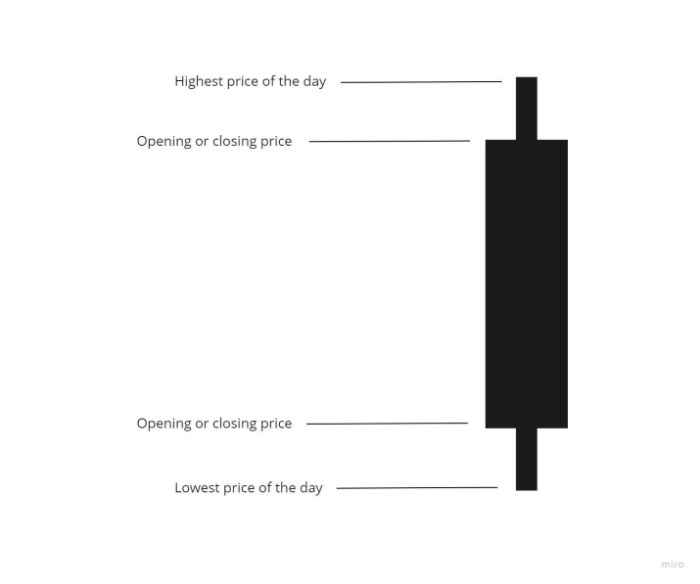
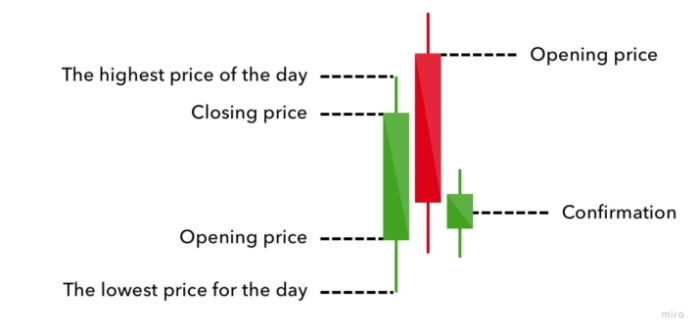
Let's first examine a candlestick chart to understand what a candlestick pattern is. A candlestick chart shows the following data for each day: the highest price at which the stock was sold, the lowest price at which the stock was sold, the price at which the stock was sold at the beginning of the day, and the price at which the stock was sold at the end of the day. The information is presented for each day in the form of a "candle," with all the candles lined up side by side.
What exactly are candlestick chart patterns then? The shape a candlestick chart can take is a candlestick pattern. Because candlestick patterns are thought to predict future price changes, traders pay attention to them. The instances below are numerous. First, though, let's learn how to interpret candlestick patterns.
Understanding candlestick patterns
There are 3 parts to a candlestick ?
The body gives the open and closing price ranges.
The wicks, which are often referred to as shadows, display the day's highs and lows.
The color represents the market's direction: Indicating a rise in price risen or white body, whereas a fall in price is represented by a red or black body.
Markets can be classified as either bullish or bearish, respectively. When stock market prices are anticipated to increase, a bull market is in effect, and when prices are anticipated to decrease, a bear market prevails.
Likewise, candlestick patterns that indicate a rise in prices are referred to as bullish, while those that indicate a decline in prices are referred to as bearish. One benefit of candlestick charts is that they rapidly convey a great deal of information, making it simple to spot patterns.
Bullish candlesticks patterns
Following a downward market trend, bullish patterns might emerge and indicate a change in the direction of price movement.
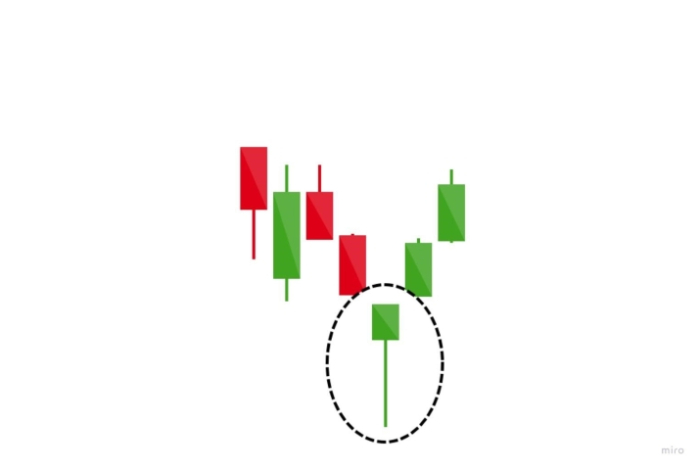
1. Hammer Candlesticks
A falling trend's bottom is marked by the hammer candlestick pattern, which has a short body and a lengthy lower wick. Although there were selling forces throughout the day, the price was finally driven back up by strong purchasing pressure, as indicated by a hammer. Red and green hammers both suggest a bull market, but green hammers signal a greater bull market.
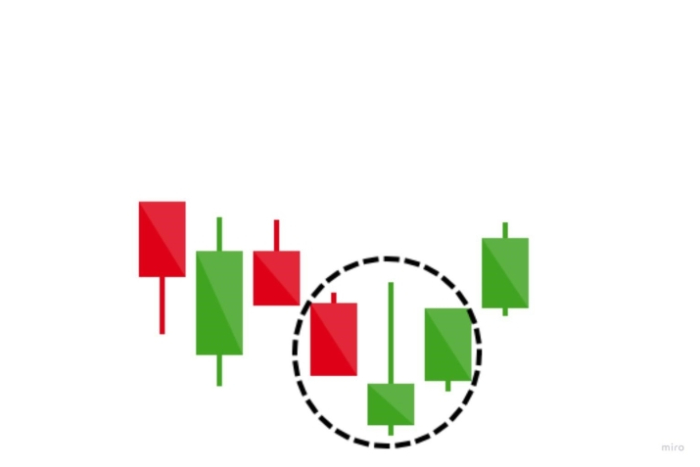
2. Inverse hammer candlesticks
There is also the inverted hammer pattern, which is bullish. The length of the top wick relative to the bottom wick is the only variation. It signifies a time when there was strong buying pressure, followed by a time when there was only weak selling pressure, which did not bring the market price down. Inverse hammer signals that buyers will soon take over the market.
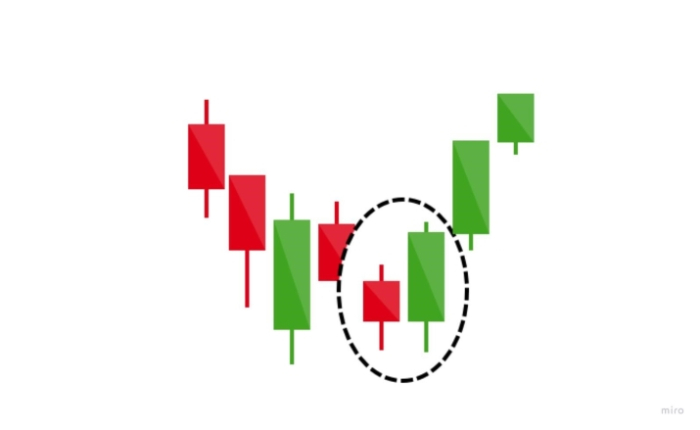
3. Bullish engulfing candlesticks
The bullish engulfing formation consists of two candles. A huge green candle has completely absorbed the smaller red candle, which was the original candle, to light the room. Despite that though starts lower than it did on day two, the bullish market pushes the price higher, giving buyers a definite advantage.
4. Piercing line candlesticks
The piercing line is a two-stick design as well, consisting of a long red candle followed by a long green candle. There is frequently a large price difference between the closing price of the first candlestick and the opening price of the green candlestick. It implies significant purchasing pressure, as the price is pushed up to or over the previous day's mid-point.
5. Morning star candlesticks
In a dreary market decline, the morning star candlestick pattern is regarded as a symbol of optimism. It's a three-stick design with one short-bodied candle sandwiched between a long red candle and one long green candle. The star has always had no overlap with the lengthier bodies due to market gaps on both open and close.
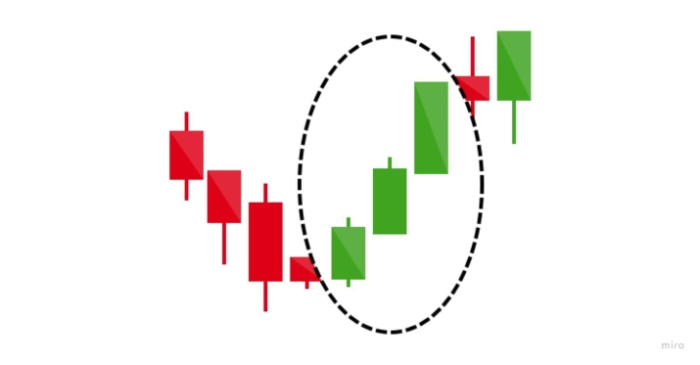
6. Three white soldiers' candlesticks
Over three days, the three white soldiers' pattern appears. It is made up of successively lengthy green (or white) candles with tiny wicks that open and close higher than the day before. It is a highly powerful bullish indicator that follows a downturn and demonstrates a continuous increase in purchasing demand.
Bearish candlesticks patterns
Typically emerging after an upswing, bearish candlestick patterns indicate a moment of resistance.
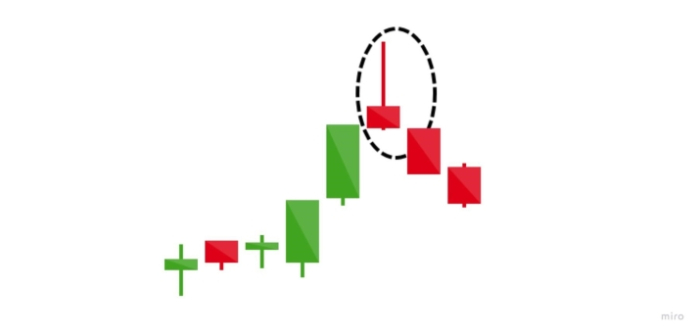
1. Hanging man candlesticks
The hanging man is the bearish version of a hammer; it forms after the conclusion of an upswing but has the same shape. It means that although there was a big sell-off during the day, purchasers were able to drive the price back up. The significant sell-off is sometimes seen as proof that the bulls are losing control of the market.
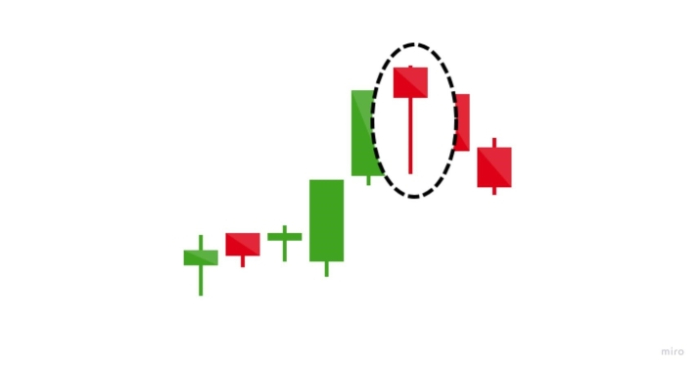
2. Shooting star candlesticks
The shooting star has a short lower body and a lengthy upper wick, and it has the same shape as the inverted hammer when it forms in an uptrend. In most cases, the market will start slightly higher, surging to an intraday high, and close at a price just above the open?like a star plummeting to earth.
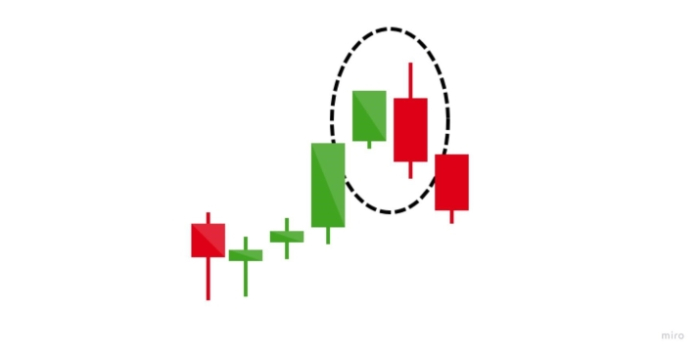
3. Bearish engulfing candlesticks
At the peak of an upswing, a bearish engulfing pattern forms. A succeeding lengthy red candle surrounds the original candle's little green body. It indicates a price peak or slowdown and foreshadows a coming market slump. The significance of the trend is anticipated to increase when the second candle drops in price.
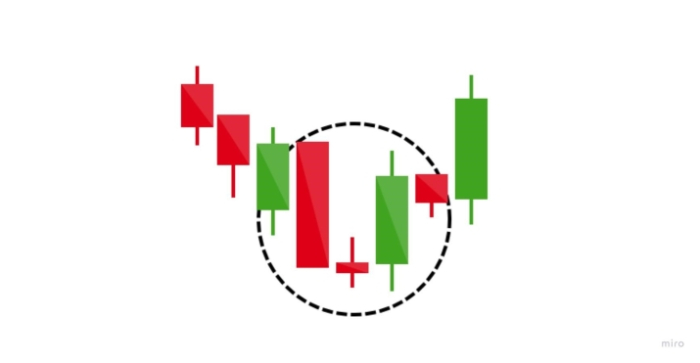
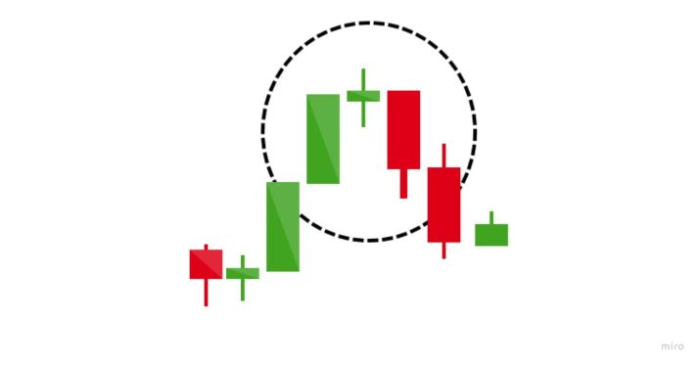
4. Evening star candlesticks
A three-candlestick pattern known as the evening star is the antithesis of the bullish morning star. It is made up of a big red candlestick and a small candle placed between two long green candles. It is especially powerful when the third candlestick reverses the gains of the first candle, which signals the end of an uptrend.
5. Three black crows candlesticks
The three red candles with the short or nonexistent wicks that make up the three black crows candlestick design are placed three at a time. Each session begins at a price that is identical to the day before but selling forces cause the price to drop steadily down with each closing. Given that the selling had outpaced the buying for three straight trading days, traders view this pattern as the beginning of a bearish decline.
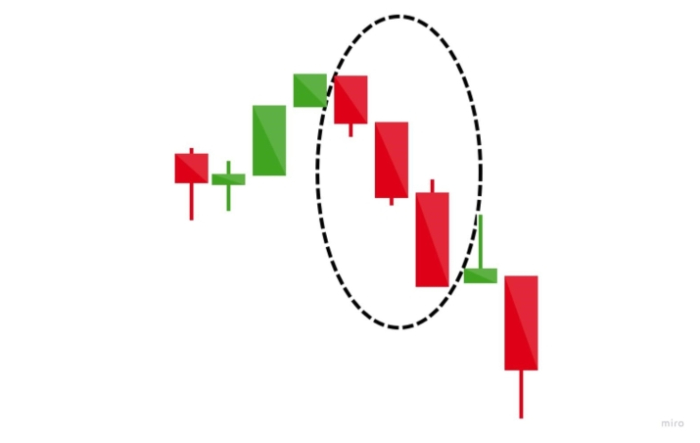
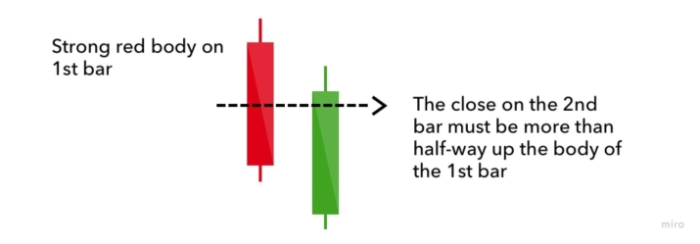
6. Dark cloud cover candlesticks
A bearish reversal is indicated by the dark cloud cover candlestick pattern, which represents a cloud of doom over the exuberance of the day before. It consists of two candlesticks, the first of which is red and opens over the second candlestick's green body before closing below halfway. It indicates that the session has been taken over by the bears since the price has fallen significantly. If the candles' wicks are short, it indicates that the downturn was quite strong.
Conclusion
So here are different types of candlestick patterns, candlestick charts are a useful method for observing changes in stock prices. There are several candlestick patterns, and each one predicts something with varying levels of accuracy. They must be interpreted in light of the other elements of the chart as well as the scenario in which they are being used. All of these variables contribute to the dynamic and volatile nature of share pricing. Algorithms and computers are often used in trading. Algorithmic trading is the use of a pre-programmed computer system that follows a certain set of instructions to execute a transaction

539 Views
