
Article Categories
- All Categories
-
 Data Structure
-
 Networking
-
 RDBMS
RDBMS
-
 Operating System
-
 Java
Java
-
 MS Excel
-
 iOS
iOS
-
 HTML
HTML
-
 CSS
CSS
-
 Android
-
 Python
-
 C Programming
-
 C++
C++
-
 C#
C#
-
 MongoDB
-
 MySQL
MySQL
-
 Javascript
-
 PHP
PHP
Selected Reading
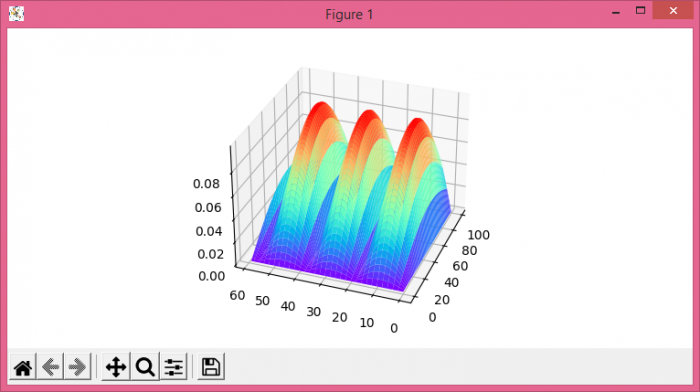
Setting the aspect ratio of a 3D plot in Matplotlib
To set the aspect ratio of a 3D plot in matplotlib, we can take the following steps−
- Using figure() method, create a new figure or activate an existing figure.
- Get the current axes, creating one if necessary, with projection='3d'.
- Create data points, R, Y and z, using numpy.
- Create a surface plot using R, Y and z.
- Set the aspect ratio using set_aspect('auto').
- Save the figure using savefig() method.
Example
from matplotlib import pyplot as plt
from matplotlib import cm
import numpy as np
plt.rcParams["figure.figsize"] = [7.50, 3.50]
plt.rcParams["figure.autolayout"] = True
fig = plt.figure()
ax = fig.gca(projection='3d')
R, Y = np.meshgrid(np.arange(0, 100, 1), np.arange(0, 60, 1))
z = 0.1 * np.abs(np.sin(R / 40) * np.sin(Y / 6))
ax.plot_surface(R, Y, z, cmap=cm.rainbow, linewidth=0)
ax.set_aspect('auto')
ax.azim = -160
ax.elev = 30
fig.savefig('data.png')
plt.show()
Output

Updated on: 2021-05-15T12:34:51+05:30
3K+ Views

Advertisements