
Article Categories
- All Categories
-
 Data Structure
-
 Networking
-
 RDBMS
RDBMS
-
 Operating System
-
 Java
Java
-
 MS Excel
-
 iOS
iOS
-
 HTML
HTML
-
 CSS
CSS
-
 Android
-
 Python
-
 C Programming
-
 C++
C++
-
 C#
C#
-
 MongoDB
-
 MySQL
MySQL
-
 Javascript
-
 PHP
PHP
-
 Economics & Finance
Selected Reading
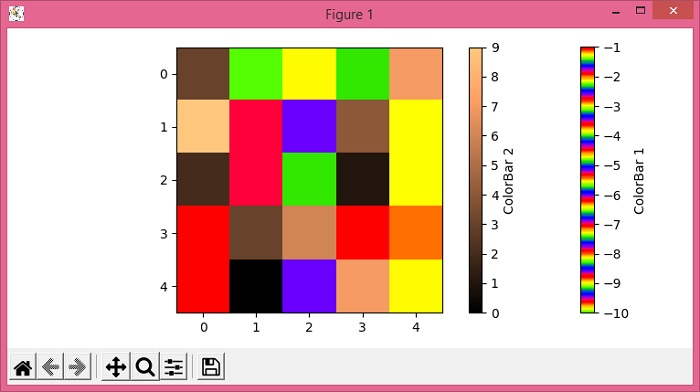
How to show two different colored colormaps in the same imshow Matplotlib?
To show two different colored colormaps in the same imshow matplotlib, we can take the following steps −
Set the figure size and adjust the padding between and around the subplots.
Make a 2D matrix of 5×5 dimension.
Get masked matrix, data1 and data2, with positive and negative values.
Create a figure and a set of subplots.
Display the data as an image, i.e., on a 2D regular raster, with data1 and data2.
To make two different colorbars, use colorbar method.
Set the colorbar for both the images.
Set the label of the colorbars.
To display the figure, use show() method.
Example
import matplotlib.pyplot as plt import numpy as np plt.rcParams["figure.figsize"] = [7.50, 3.50] plt.rcParams["figure.autolayout"] = True img = np.random.randint(-10, 10, (5, 5)) data1 = np.ma.masked_array(img, img >= 0) data2 = np.ma.masked_array(img, imgOutput

Updated on: 2021-06-03T13:00:42+05:30
2K+ Views

Advertisements