
 Data Structure
 Networking
 RDBMS
RDBMS Operating System
 Java
Java MS Excel
 iOS
iOS HTML
HTML CSS
CSS Android
 Python
 C Programming
 C++
C++ C#
C# MongoDB
 MySQL
MySQL Javascript
 PHP
PHP
- Selected Reading
- UPSC IAS Exams Notes
- Developer's Best Practices
- Questions and Answers
- Effective Resume Writing
- HR Interview Questions
- Computer Glossary
- Who is Who
Save the plots into a PDF in matplotlib
Using plt.savefig("myImagePDF.pdf", format="pdf", bbox_inches="tight") method, we can save a figure in PDF format.
Steps
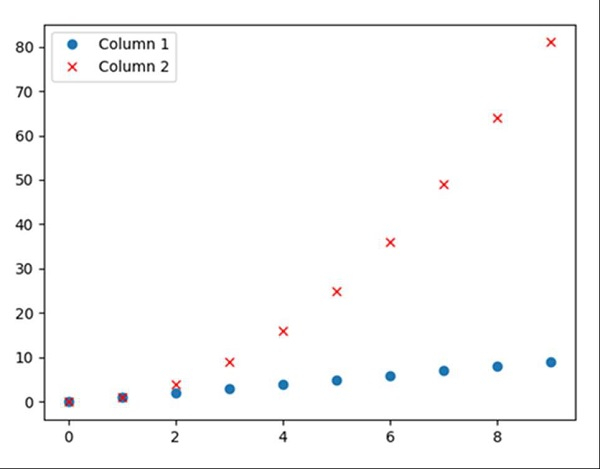
Create a dictionary with Column 1 and Column 2 as the keys and Values are like i and i*i, where i is from 0 to 10, respectively.
Create a data frame using pd.DataFrame(d), d created in step 1.
Plot the data frame with ?o' and ?rx' style.
To save the file in PDF format, use savefig() method where the image name is myImagePDF.pdf, format = "pdf".
To show the image, use the plt.show() method.
Example
import pandas as pd
from matplotlib import pyplot as plt

d = {'Column 1': [i for i in range(10)], 'Column 2': [i * i for i in range(10)]}

df = pd.DataFrame(d)

df.plot(style=['o', 'rx'])
plt.savefig("myImagePDF.pdf", format="pdf", bbox_inches="tight")
plt.show()
Output

Updated on: 2023-09-12T03:11:35+05:30
70K+ Views

Advertisements