
 Data Structure
 Networking
 RDBMS
RDBMS Operating System
 Java
Java MS Excel
 iOS
iOS HTML
HTML CSS
CSS Android
 Python
 C Programming
 C++
C++ C#
C# MongoDB
 MySQL
MySQL Javascript
 PHP
PHP
- Selected Reading
- UPSC IAS Exams Notes
- Developer's Best Practices
- Questions and Answers
- Effective Resume Writing
- HR Interview Questions
- Computer Glossary
- Who is Who
Quartiles
Introduction
In statistics, three major terms are used to describe the central tendencies of data, i.e., mean, median, and mode. However, these terms refer to a specific number that represents the central value. However, quartile is another statistical term used to describe the data more efficiently than the above term. The concept of quartile is generally used to compare the data of one company with another. In addition, it is used to represent the median and quartiles graphically. In this tutorial, we will learn about the definition, formula, deviation, range, and some solved examples related to quartiles.
Definition
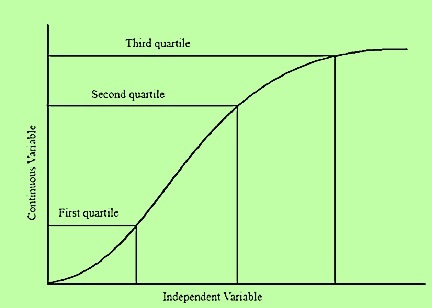
The quartile is defined as a category of quantile that divides a group into four parts or quarters. The quantiles are the cut points that divide the continuous distribution into equal probabilities. These are one type of percentile. The quartiles have three points such as first (Q1), second (Q2), and third (Q3) quartiles. In addition, the second quartile (Q2) is the median of the remaining two quartiles. It is necessary to arrange the data in ascending order to find the quartiles of a dataset.
Formula
There exist formulae to determine the quartiles of a dataset. Using the formula, we can determine the first (lies between the first term and median), second (median), and third quartiles (lies between median and last term). Before the calculation, the dataset should be arranged in ascending order. The formulae to calculate the quartiles of a given dataset are as follows
First quartile (Q1) or lower quartile: $\mathrm{(\frac{m+1}{4})^{th}}$ term
Second quartile (Q2) or inter quartile: $\mathrm{(\frac{m+1}{2})^{th}}$ term
Third quartile (Q3) or upper quartile: $\mathrm{(\frac{3(m+1)}{4})^{th}}$ term
Quartiles in Statistics
We have seen that the quartile divides the group into four parts. Each part lies within a specific range. Therefore the range of each quartile is described below.
| Symbol | Name of quartile | Range |
|---|---|---|
| Q1 | First or lower quartile | Separate the lowest 25 % from the whole data |
| Q2 | Second quartile or median | Lies on the median value, which means it separates the data into two halves |
| Q3 | Third or upper quartile | Separate the highest 25 % from the whole data |
Quartile Deviation
It is defined as a statistical measure that evaluates the deviation of data using the average value. In other words, it determined the average value of the data. It tells about the spread of the distribution. It is also called semi interquartile range. Mathematically, it can be represented as
Quartile deviation $\mathrm{= \frac{Q_3-Q_1}{2}}$
where Q3-Q1 is the interquartile range.
The quartile deviation can be determined for both grouped and ungrouped data. Let's discuss the procedure to evaluate the quartile deviation.
In the first step, arrange the data in ascending order for both grouped and ungrouped data.
-
Evaluate the first quartile using the following formulae
Ungrouped data:$\mathrm{(Q_1) (\frac{m+1}{4})^{th}}$ term
Grouped data: $\mathrm{Q_1=p_1+\frac{\frac{N}{4}-c}{f}(p_2-p_1)}$
where m is the number of quartiles. In addition, p1 and p2 are the lower and upper limits of data. N, f, and c are the total frequency, frequency of the particular class, and cumulative frequency, respectively.
-
Find the third quartile using the following formulae as
Ungrouped data: $\mathrm{(Q_3) \:\: (\frac{3(m+1)}{4})^{th}}$ term
Grouped data: $\mathrm{Q_3=p_1+\frac{\frac{3N}{4}-c}{f}(p_2-p_1)}$
-
Now, we can determine the quartile deviation using the formula as
Quartile deviation = $\mathrm{= \frac{Q_3-Q_1}{2}}$
Interquartile Range
The interquartile range is the difference between the first and third quartiles. It measures the spread of data, which means it measures the middle 50 % of the data set.
The mathematical expression to evaluate the interquartile range is
$$\mathrm{Interquartile\:\: range = Q_3-Q_1=(\frac{3(m+1)}{4})^{th} term-(\frac{(m+1)}{4})^{th} term }$$
Let's discuss the procedure to evaluate the interquartile range.
Step 1: Arrange the data in ascending order for both grouped and ungrouped data.
-
Step 2: Find the median (Q2) of the dataset by using the following formula.
For even number of dataset: $\mathrm{Q_2=\frac{(\frac{n}{2})^{th} term+(\frac{n}{2}+1)^{th} term}{2}}$
For odd number of dataset: $\mathrm{Q_2=(\frac{n+1}{2})^{th} term}$
Step 3: Find the quartile Q1, which is the median of the data points left of the median found in step 2.
-
Step 4: Find the quartile Q3, which is the median of the data points right of the median found in step 2.
Interquartile range = Q3-Q1
Solved Examples
Example 1:
Evaluate the median, lower quartile, upper quartile, and interquartile range of the following data set
23, 56, 110, 12, 6, 89, 103
We have to arrange the dataset in ascending order as follows
6, 12, 23, 56, 89, 103, 110
Since there are odd numbers (i.e., 7) of elements, the median $\mathrm{=(\frac{7+1}{2})^{th} term=12}$
First quartile (Q1) or lower quartile:=$\mathrm{(\frac{m+1}{4})^{th} term=(\frac{7+1}{4})^{th} term=56}$
Third quartile (Q3) or upper quartile: $\mathrm{(\frac{3(m+1)}{4})^{th} term=(\frac{3(7+1)}{4})^{th} term=89}$
Interquartile range =Q3-Q1=89-56=33
? The median, lower quartile, upper quartile, and interquartile range of the following data set are 12, 56, 89, and 33, respectively.
Example 2:
Find the quartile deviation and interquartile range of the following dataset
8, 20, 5, 16, 49, 32, 78, 56, 11, 39, 1
Solution:
We have to arrange the dataset in ascending order as follows
1, 5, 8, 11, 16, 20, 32, 39, 49, 56, 78
Since, there are odd number (i.e., 11) of elements, the median =$\mathrm{(\frac{11+1}{2})^{th} term= 32}$
First quartile (Q_1) or lower quartile:=$\mathrm{(\frac{m+1}{4})^{th} term=(\frac{11+1}{4})^{th} term=5}$
Third quartile (Q_3) or upper quartile: $\mathrm{(\frac{3(11+1)}{4})^{th} term=(\frac{3(11+1)}{4})^{th} term=11}$
Quartile deviation $\mathrm{= \frac{Q_3-Q_1}{2}=\frac{11-5}{2}=3 }$
Now, interquartile range $\mathrm{=Q_3-Q_1=11-5=6}$
? The quartile deviation and interquartile deviation of the data set are 3 and 6, respectively.
Conclusion
The present tutorial gives a brief introduction to quartiles and its application in statistics. In addition, the basic formulae related to quartile deviation and interquartile range have been illustrated. Moreover, some solved examples have been provided for better clarity of this concept. In conclusion, the present tutorial may be useful for understanding the basic concept of the quartiles.
FAQs
1. How do you determine the coefficient of quartile deviation?
The coefficient of quartile deviation can be determined using the following expression $\mathrm{\frac{Q_3-Q_1}{Q_3+Q_1}}$.
2. What is the difference between standard deviation and quartile deviation?
The standard deviation is used to measure the dispersion of data when the extreme outlier is given. If no extreme outlier is provided, then we should use quartile deviation to determine the spread distribution of data.
3. What are the applications of quartiles?
A quartile is a statistical tool used to create a box plot of the dataset. In addition, it is helpful to compare the data of one company with another.
4. Which quartile is said to be the median of the dataset?
The second quartile is the median of the dataset.
5. Which region belongs to the first quartile?
The first quartile splits the first 25 % from the upper 75 % of the dataset.

486 Views
