
 Data Structure
 Networking
 RDBMS
RDBMS Operating System
 Java
Java MS Excel
 iOS
iOS HTML
HTML CSS
CSS Android
 Python
 C Programming
 C++
C++ C#
C# MongoDB
 MySQL
MySQL Javascript
 PHP
PHP
- Selected Reading
- UPSC IAS Exams Notes
- Developer's Best Practices
- Questions and Answers
- Effective Resume Writing
- HR Interview Questions
- Computer Glossary
- Who is Who
Python - Plot a Pandas DataFrame in a Line Graph
To plot a DataFrame in a Line Graph, use the plot() method and set the kind parameter to line. Let us first import the required libraries −
import pandas as pd
import matplotlib.pyplot as mp
Following is our data with Team Records −
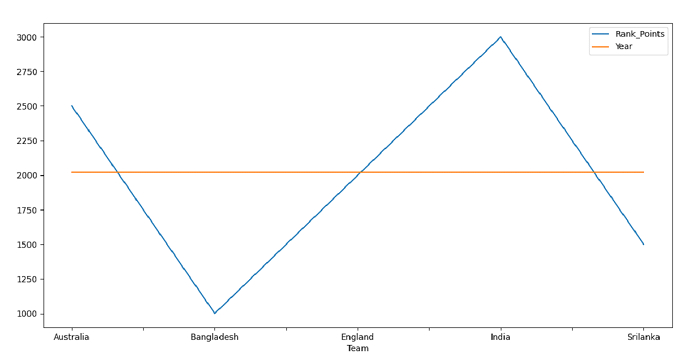
data = [["Australia", 2500, 2021],["Bangladesh", 1000, 2021],["England", 2000, 2021],["India", 3000, 2021],["Srilanka", 1500, 2021]]
Set the data as Pandas DataFrame and add columns −
dataFrame = pd.DataFrame(data, columns=["Team","Rank_Points", "Year"])
Plot the Pandas DataFrame in a line graph. We have set the “kind” parameter as “line” for this −
dataFrame.plot(x="Team", y=["Rank_Points","Year" ], kind="line", figsize=(10, 9))
Example
Following is the code −
import pandas as pd
import matplotlib.pyplot as mp

# our data
data = [["Australia", 2500, 2021],["Bangladesh", 1000, 2021],["England", 2000, 2021],["India", 3000, 2021],["Srilanka", 1500, 2021]]

# dataframe
dataFrame = pd.DataFrame(data, columns=["Team","Rank_Points", "Year"])

# plotting the dataframe
dataFrame.plot(x="Team", y=["Rank_Points","Year" ], kind="line", figsize=(10, 9))

# displaying line graph
mp.show()
Output
This will produce the following output −

Updated on: 2021-09-29T11:16:12+05:30
2K+ Views

Advertisements