- PySimpleGUI - Home
- PySimpleGUI - Introduction
- PySimpleGUI - Environment Setup
- PySimpleGUI - Hello World
- PySimpleGUI - Popup Windows
- PySimpleGUI - Window Class
- PySimpleGUI - Element Class
- PySimpleGUI - Events
- PySimpleGUI - Menubar
- PySimpleGUI - Matplotlib Integration
- PySimpleGUI - Working with PIL
- PySimpleGUI - Debugger
- PySimpleGUI - Settings
- PySimpleGUI Useful Resources
- PySimpleGUI - Quick Guide
- PySimpleGUI - Useful Resources
- PySimpleGUI - Discussion
PySimpleGUI - Graph Element
The Graph element is similar to Canvas, but very powerful. You can define your own coordinate system, working in your own units, and then displaying them in an area defined in pixels.
You should provide the following values to the Graph object −
Size of the canvas in pixels
The lower left (x,y) coordinate of your coordinate system
The upper right (x,y) coordinate of your coordinate system
Graph Figures are created, and a Figure ID is obtained by calling following methods which are similar to the Tkinter Canvas −
draw_arc(self, top_left, bottom_right, extent, start_angle, style=None, arc_color='black', line_width=1, fill_color=None)
draw_circle(self, center_location, radius, fill_color=None, line_color='black', line_width=1)
draw_image(self, filename=None, data=None,  location=(None, None))
draw_line(self, point_from, point_to, color='black', width=1)
draw_lines(self, points, color='black', width=1)
draw_oval(self, top_left, bottom_right, fill_color=None, line_color=None, line_width=1)
draw_point(self, point, size=2, color='black')
draw_polygon(self, points, fill_color=None, line_color=None, line_width=None)
draw_rectangle(self, top_left, bottom_right, fill_color=None, line_color=None, line_width=None)
draw_text(self, text, location, color='black', font=None, angle=0, text_location='center')
Apart from the above draw methods, the Graph class also defines the move_figure() method by which the image identified by its ID is moved to its new position by giving new coordinates relative to its previous coordinates.
move_figure(self, figure, x_direction, y_direction)
The mouse event inside the graph area can be captured if you set drag_submits property to True. When you click anywhere in the graph area, the event generated is: Graph_key + '+UP'.
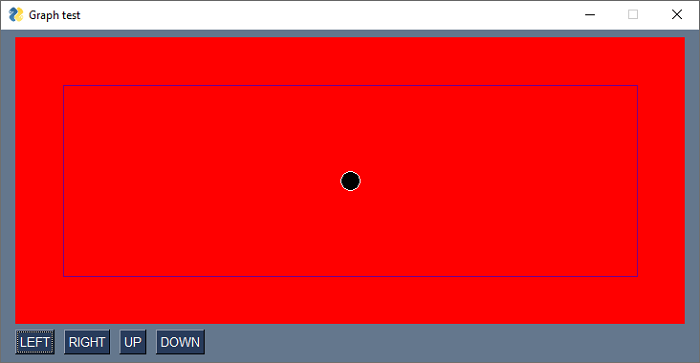
In the following example, we draw a small circle at the center of the graph element. Below the graph object, there are buttons for moving the circle in left, right, up and down direction. When clicked, the mov_figure() method is called.
import PySimpleGUI as psg
graph=psg.Graph(canvas_size=(700,300), graph_bottom_left=(0, 0), graph_top_right=(700,300),
 background_color='red', enable_events=True, drag_submits=True, key='graph')
layout = [[graph], [psg.Button('LEFT'), psg.Button('RIGHT'), psg.Button('UP'), psg.Button('DOWN')]]
window = psg.Window('Graph test', layout, finalize=True)
x1,y1 = 350,150
circle = graph.draw_circle((x1,y1), 10, fill_color='black', line_color='white')
rectangle = graph.draw_rectangle((50,50), (650,250), line_color='purple')
while True:
   event, values = window.read()
   if event == psg.WIN_CLOSED:
      break
   if event == 'RIGHT':
      graph.MoveFigure(circle, 10, 0)
   if event == 'LEFT':
      graph.MoveFigure(circle, -10,0)
   if event == 'UP':
      graph.MoveFigure(circle, 0, 10)
   if event == 'DOWN':
      graph.MoveFigure(circle, 0,-10)
   if event=="graph+UP":
      x2,y2= values['graph']
      graph.MoveFigure(circle, x2-x1, y2-y1)
      x1,y1=x2,y2
window.close()
Run the above program. Use the buttons to move the circle.