
 Data Structure
 Networking
 RDBMS
RDBMS Operating System
 Java
Java MS Excel
 iOS
iOS HTML
HTML CSS
CSS Android
 Python
 C Programming
 C++
C++ C#
C# MongoDB
 MySQL
MySQL Javascript
 PHP
PHP
- Selected Reading
- UPSC IAS Exams Notes
- Developer's Best Practices
- Questions and Answers
- Effective Resume Writing
- HR Interview Questions
- Computer Glossary
- Who is Who
OpenCV Python Program to analyze an image using Histogram
A histogram is a graphical representation showing how the pixel intensities (ranging from 0 to 255) are distributed in an image. For a digital image histogram plots a graph between pixel intensity versus the number of pixels. The x-axis has intensity variations, and the y-axis indicates the number of pixels in that particular intensity.
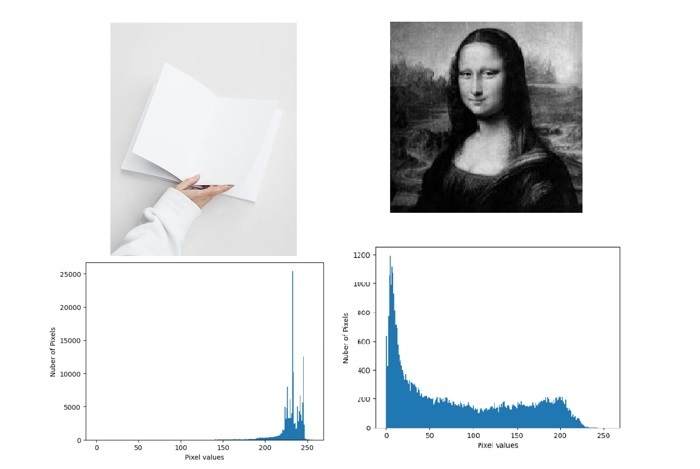
We can see the images and its histograms. By simply looking at the histogram of an image, we can get basic idea about contrast, brightness, intensity distribution etc of that image.
In this article, we will write a python program using the OpenCV module to analyze a grayscale image and a color image using the Histogram.
The cv2.calcHist() function
OpenCV provides a calcHist() function to calculate a histogram of one or more image arrays. Following is the syntax of the calcHist() function -
calcHist(images, channels, mask, histSize, ranges[, hist[, accumulate]])
Parameters
images: source image. it should be given in square brackets, ie, [image].
channels: It specifies the index of the channel for which we calculate the histogram. If the image is a grayscale image, its value is [0] and if the image is a color image, then we need to pass [0], [1] or [2] to calculate the histogram of blue, green, or red channels respectively.
mask: mask image. if you want to find the histogram of a particular region of an image, then we have to create a mask for the unwanted region. None if we want to find the histogram of the full image.
histSize: Array of histogram sizes.
ranges: Normally, it is [0,256].
Example
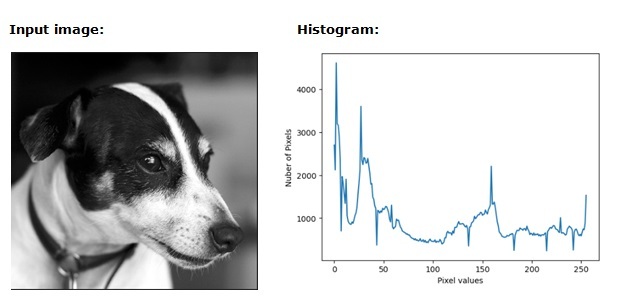
In this example, we will find the histogram of an image in grayscale mode.
import matplotlib.pyplot as plt
import cv2

img = cv2.imread('Images/Dog.jpg')
histogram = cv2.calcHist([img],[0],None,[256],[0,256])

plt.xlabel("Pixel values")
plt.ylabel("Nuber of Pixels")
plt.plot(histogram)
plt.show()
Output
Example
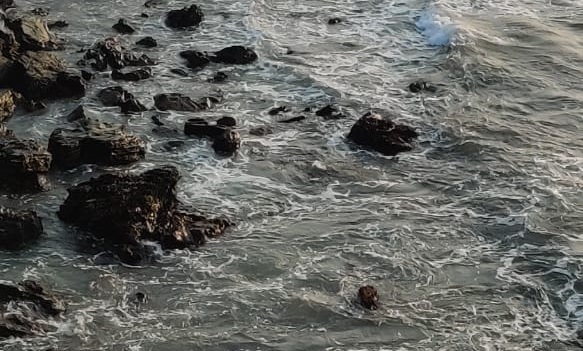
Let's find the histogram of an image in color mode.
import matplotlib.pyplot as plt
import cv2

image = cv2.imread('Images/Sky and Beach.jpg')
# split the image into its respective channels
channels = cv2.split(image)
colors = ("b", "g", "r")

plt.title("Color Histogram")
plt.xlabel("Pixel values")
plt.ylabel("Nuber of Pixels")

# loop over the image channels
for (chan, color) in zip(channels, colors):

   # create a histogram for the current channel and plot it
   hist = cv2.calcHist([chan], [0], None, [256], [0, 256])
   plt.plot(hist, color=color)
   plt.xlim([0, 256])
Input image
Output image
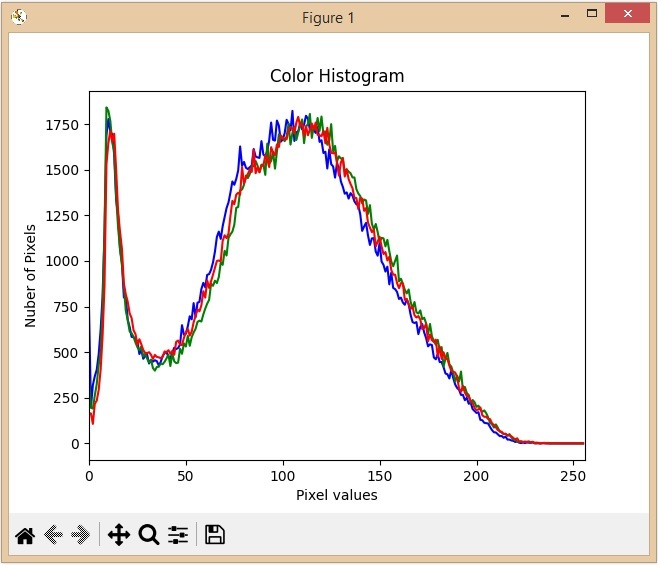
From the above histogram, we can observe that blue has some high-value areas in the image.
810 Views
