 Data Structure
 Networking
 RDBMS
RDBMS Operating System
 Java
Java MS Excel
 iOS
iOS HTML
HTML CSS
CSS Android
 Python
 C Programming
 C++
C++ C#
C# MongoDB
 MySQL
MySQL Javascript
 PHP
PHPPhysics
Chemistry
Biology
Mathematics
English
Economics
Psychology
Social Studies
Fashion Studies
Legal Studies
- Selected Reading
- UPSC IAS Exams Notes
- Developer's Best Practices
- Questions and Answers
- Effective Resume Writing
- HR Interview Questions
- Computer Glossary
- Who is Who
Opencv Python – How to display the coordinates of points clicked on an image?
OpenCV provides us with different types of mouse events. There are different types of muse events such as left or right button click, mouse move, left button double click etc. A mouse event returns the coordinates (x,y) of the mouse event. To perform an action when an event is performed we define a mouse callback function. We use left button click (cv2.EVENT_LBUTTONDOWN) and right button click (cv2.EVENT_RBUTTONDOWN) to display the coordinates of the points clicked on the image.
Steps
To display the coordinates of points clicked on the input image, you can follow the steps given below −
Import the required library OpenCV. Make sure you have already installed it.
Define a mouse callback function to display the coordinates of points clicked on the input image. The mouse callback function is executed when a mouse event happens. A mouse event gives the coordinate (x, y) of the mouse event. Here we define a mouse callback function to display the coordinates of points clicked on the input image when a mouse left click (EVENT_LBUTTONDOWN) or right click (EVENT_RBUTTONDOWN) is performed. Within this callback function we display the coordinates as the texts and points as circles with small radius.
Read the input image using the cv2.imread() function.
Define a new window and bind the above defined callback function to the window using cv2.setMouseCallback().
Display the image window. This window opens the input image on which we display the coordinate of the point where the mouse event occurs. To close the window press esc button.
Let's look at some program examples to understand in a better way.
Input Image
We will use this image as an input file in the examples below.

Example
In the python code below we display the coordinates of the points when a left click (EVENT_LBUTTONDOWN) on the image is performed. We also draw the points on the image.
# import the required library
import cv2

# define a function to display the coordinates of

# of the points clicked on the image
def click_event(event, x, y, flags, params):
   if event == cv2.EVENT_LBUTTONDOWN:
      print(f'({x},{y})')

      # put coordinates as text on the image
      cv2.putText(img, f'({x},{y})',(x,y),
      cv2.FONT_HERSHEY_SIMPLEX, 1, (0, 0, 255), 2)

      # draw point on the image
      cv2.circle(img, (x,y), 3, (0,255,255), -1)

# read the input image
img = cv2.imread('back2school.jpg')

# create a window
cv2.namedWindow('Point Coordinates')

# bind the callback function to window
cv2.setMouseCallback('Point Coordinates', click_event)

# display the image
while True:
   cv2.imshow('Point Coordinates',img)
   k = cv2.waitKey(1) & 0xFF
   if k == 27:
      break
cv2.destroyAllWindows()
Output
When you execute the above code, it will produce the following output −
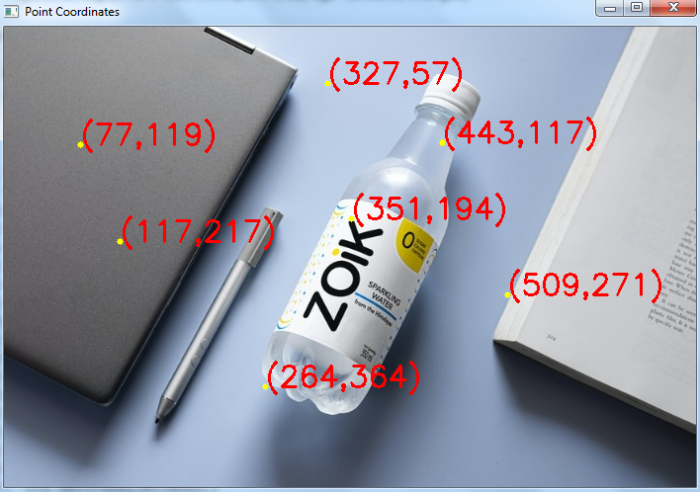
(77,119)
(327,57)
(117,217)
(351,194)
(509,271)
(264,364)
(443,117)
And we get the below window showing the output −

In the above output image, the points are drawn with yellow color and point coordinates are in red color
Example
In this example, we display the coordinates of the points when a left click (EVENT_LBUTTONDOWN) or a right click (EVENT_RBUTTONDOWN) on the image is performed. We also draw the points on the image.
# import required library
import cv2

# function to display the coordinates of the points clicked on the image
def click_event(event, x, y, flags, params):

   # checking for left mouse clicks
   if event == cv2.EVENT_LBUTTONDOWN:
      print('Left Click')
      print(f'({x},{y})')

   # put coordinates as text on the image
   cv2.putText(img, f'({x},{y})', (x, y),   cv2.FONT_HERSHEY_SIMPLEX, 1, (255, 0, 0), 2)
   cv2.circle(img, (x, y), 3, (0, 0, 255), -1)
   if event == cv2.EVENT_RBUTTONDOWN:
      print('Right Click')
      print(f'({x},{y})')

      # put coordinates as text on the image
      cv2.putText(img, f'({x},{y})', (x, y),
      cv2.FONT_HERSHEY_SIMPLEX, 1, (0, 255, 255), 2)
      cv2.circle(img, (x, y), 3, (0, 0, 255), -1)

# read the input image
img = cv2.imread('back2school.jpg')

# create a window
cv2.namedWindow('Point Coordinates')

# bind the callback function to window
cv2.setMouseCallback('Point Coordinates', click_event)

# display the image
while True:
   cv2.imshow('Point Coordinates', img)
   k = cv2.waitKey(1) & 0xFF
   if k == 27:
      break
cv2.destroyAllWindows()
Output
When you execute the above code, it will produce the following output.
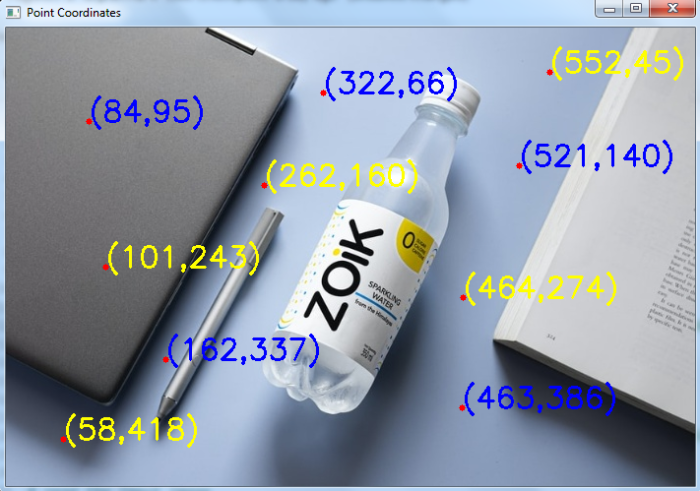
Left Click
(84,95)
Left Click
(322,66)
Right Click
(262,160)
Right Click
(464,274)
Right Click
(552,45)
Left Click
(162,337)
Left Click
(521,140)
Right Click
(101,243)
Left Click
(463,386)
Right Click
(58,418)
And we get the below window, showing the output −

In the above output image, the points are drawn with red color and point coordinates (left click) in blue color and the point coordinates (right click) in yellow color.

