
 Data Structure
 Networking
 RDBMS
RDBMS Operating System
 Java
Java MS Excel
 iOS
iOS HTML
HTML CSS
CSS Android
 Python
 C Programming
 C++
C++ C#
C# MongoDB
 MySQL
MySQL Javascript
 PHP
PHP
- Selected Reading
- UPSC IAS Exams Notes
- Developer's Best Practices
- Questions and Answers
- Effective Resume Writing
- HR Interview Questions
- Computer Glossary
- Who is Who
Median of Data
Introduction
Any group's median is the value that falls in the middle. At this stage, half of the data is more, and half is less. The median makes it possible to express a lot of data points with just one. The median is the most straightforward statistical metric to compute. The middle data point reflects the median of the data after the data is organised in ascending order for the purpose of calculating the median.
Central Tendencies
One of the three measurements of central tendency is the median. The centre position of the data set is noted while discussing a set of data. This is referred to as the central tendency measure. The mean, median, and mode are the three most frequently used metrics of central tendency.
In this tutorial, we will keep our focus on the median only.
Median
The middle number, or centre value within a set of data, is known as the median . The number that falls in the middle of the range is also the median.
The data should first be ordered from least to greatest or from greatest to least value in order to get the median. A median is a value that is between the upper and lower halves of a population, a probability distribution, or a sample of data. For various types of distribution, the median varies.
In order to get the median for a given set of data, let's look at an example.
Step 1 Take into account the numbers 5, 5, 7, 4, and 3. Let's organise these numbers ascendingly: 3, 4, 5, 5, 7.
Step 2 Count the values.
5 values are available.
Step 3 Find the midpoint value.
The median is the midpoint. Consequently, the median is 5.
Median of an Ungrouped Data with Odd Number of Entries
The steps listed below are beneficial when using the median formula for ungrouped data.
Step 1 Sort the information into ascending or descending order.
Step 2 Next, tally the overall 'n' number of observations.
Step 3 Determine whether "n" is an even or an odd number of observations.
If the data has an odd number of entries, then the formula for a given set of numbers, say one with "n" odd observations, can be written as follows
$$\mathrm{Median=[\frac{(n+1)}{2}]^{th} term}$$
Median of an Ungrouped Data with Even Number of Entries
The median formula for a given set of numbers, let's say one with "n" even observations, can be written as follows
$$\mathrm{Median= \frac{[(\frac{n}{2})^{th} term+((\frac{n}{2})+1)^{th} term]}{2}}$$
Median of a Grouped Data
The following steps are used to determine the median when the data is continuous and represented as a frequency distribution.
Step 1 Find the total number of observations in step one (n).
Step 2 Determine the class size(h) and create various classes for the data.
Step 3 Calculate the cumulative frequency for each class in step three.
Step 4 Determine which class the median belongs to. (N/2 lies in the class defined by the median.)
Step 5 Determine the median class(lower)'s limit and the cumulative frequency of the class that came before the median class (c).
The median value can now be determined using the formula below.
$$\mathrm{Median=l+[\frac{\frac{n}{2}-cf}{f}]Ãh}$$
Less Than CF table
To make the less than CF table, we should write the frequency of the class by adding all the previous class's frequencies to the frequency of the current class.
The following table shows the implementation of less than CF tables.
| Sports Type | Level | No of players | Cumulative Frequency |
|---|---|---|---|
| Football | Under 19 | 16 | 16 |
| Cricket | Under 16 | 22 | 38 |
| Badminton | Under 14 | 30 | 68 |
| Table Tennis | Under 16 | 15 | 83 |
More Than CF table
By calculating the cumulative total frequencies from the highest class to the lowest class, the greater than cumulative frequency distribution is derived.
The following table shows the implementation of more than CF tables.
| Sports Type | Level | No of players | Cumulative Frequency |
|---|---|---|---|
| Football | Under 19 | 16 | 83 |
| Cricket | Under 16 | 22 | 67 |
| Badminton | Under 14 | 30 | 45 |
| Table Tennis | Under 16 | 15 | 15 |
Ogive Curves
The properties of discrete and continuous data are displayed using frequency curves, which are frequency distribution curves. These graphs capture the attention more than the tabulated data does. It makes it easier for us to compare at least two frequency distributions. The two frequency distributions' patterns and shapes are comparable.
The following are the two types of ogive curves
Less than Ogive We can get this curve by plotting the less than CF table.
More than Ogive We can get this curve by plotting the more than CF table.
Ogive Curves to find Median
By using ogive curves, we can find the median, so to find the median, we need to plot the less than ogive curve and more than ogive curve on the same graph, and the point where these two curves intersect is the median.
Solved Examples
Example 1 Make a more than cumulative frequency table for the given data.
| Scores | 1-6 | 7-16 | 17-25 | 26-36 | 37-47 | 47-60 |
|---|---|---|---|---|---|---|
| Frequency | 2 | 4 | 13 | 18 | 10 | 4 |
Solution:
| Scores | Frequency | Cumulative Frequency (More than) |
|---|---|---|
| 1-6 | 2 | 51 |
| 7-16 | 4 | 49 |
| 17-25 | 13 | 45 |
| 26-36 | 18 | 32 |
| 37-47 | 10 | 14 |
| 47-60 | 4 | 4 |
Example 2: Find the median using the ogive curve for the data given in Example 1
Solution:
| Scores | Frequency | Cumulative Frequency (More than) | Cumulative Frequency (Less than) |
|---|---|---|---|
| 1-6 | 2 | 51 | 2 |
| 7-16 | 4 | 49 | 6 |
| 17-25 | 13 | 45 | 19 |
| 26-36 | 18 | 32 | 37 |
| 37-47 | 10 | 14 | 47 |
| 47-60 | 4 | 4 | 51 |
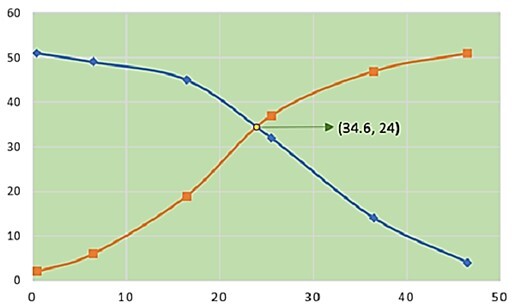
As we can see, the more than and less than CF curves intersect at 34.6 frequency. Hence, the median of the given data is 34.6.
Conclusion
The middle number, or centre value within a set of data, is known as the median.
One of the three measurements of central tendency is the median.
The centre position of the data set is noted while discussing a set of data. This is referred to as the central tendency measure.
Median of a grouped data
$$\mathrm{Median=l+[\frac{\frac{n}{2}-cf}{f}]Ãh}$$
FAQs
1. What is the median of an ungrouped data with even number of entries?
The median of an ungrouped data with even number of entries is given by the following formula: $\mathrm{Median=[\frac{(n+1)}{2}]^{th}}$ term
2. Why are Ogive curves used to show data instead of tables?
Ogive graphs capture the attention more than the tabulated data does. It makes it easier for us to compare at least two frequency distributions.
3. How to find the median using ogive curves?
Plot the more than and less than ogive curves on the same graph, and the point where the two curves intersect gives us our median.
4. What is the formula for the median of a grouped data?
The following formula is used to find the median of a grouped data$\mathrm{Median=l+[\frac{\frac{n}{2}-cf}{f}]Ãh}$
5. What is less than CF table?
To make the less than CF table, write the frequency of the class by adding all the previous class's frequencies to the frequency of the current class.

272 Views
