
Article Categories
- All Categories
-
 Data Structure
-
 Networking
-
 RDBMS
RDBMS
-
 Operating System
-
 Java
Java
-
 MS Excel
-
 iOS
iOS
-
 HTML
HTML
-
 CSS
CSS
-
 Android
-
 Python
-
 C Programming
-
 C++
C++
-
 C#
C#
-
 MongoDB
-
 MySQL
MySQL
-
 Javascript
-
 PHP
PHP
Measuring Central Tendency: Mode, Median, Mean
Introduction
The measure of central tendency, also know as measures of center or central location, refers to a measure of summary that tries to represent the whole data set with a single value that shows the center value of the distribution.
Three key measures of central tendency are recognized, namely, the mode, median, and mean. Each of these values shows a different indication of the central value of the distribution.
The Mode
The value that most commonly occurs in a distribution is the Mode. Considering the age of 11 players who are selected for a certain competition.
The following table shows a frequency distribution for the age of players' data
Age |
Frequency |
|---|---|
16 |
3 |
17 |
2 |
18 |
2 |
19 |
1 |
20 |
1 |
21 |
2 |
The most common value here is 16. So, the mode of the data is 16 years.
Advantage of Mode
The key advantage of the mode is that it can be calculated for both numerical and non- numerical data. Median and mode cannot be done so.
Limitations of the mode
-
In certain cases, the mode may not be able to represent the center of the data set clearly. When the distribution of age of players is arranged in ascending order we get
16,16,16,17,17,18,18, 19,20,21,21 It is easy to see here that the central value here is either 18, not 16. However, the mode represents the central value as 16.
-
There may be more than one mode of data. Consider the following set of data on the age of players.
16,16,16,17,17,18,18,18,19,20,21 Here, we may get two modes - 16, and 18. Hence, it is bi-modal. It is notable that multi- modal data sets are also available in most cases. Hence, in many cases, it is impossible to find one measure of central tendency via mode as there may be more than one value of the most commonly occurring data.
-
Now, consider a continuous data set.
16,17,18,19,20,21,22,23,24,25,26 Here, the data on the age of players is continuous and it has no mode at all. So, for continuous data sets, there may be no mode.
The Median
The median is the middle value of a data set when the set is arranged in an ascending or a descending order.
For the age of players, we get the data set arranged in ascending order
The middle value here is 18. So, the median is 18.
When the data set has an even number of observations, the average of two middle values is taken as the median. Consider the following data set.
The median of this data set will be the average of 18 and 19 which is 18.5. So, the median, in this case, is 18.5.
Advantage of the Median
The median is usually less affected by skewed data than the mean. It is also less affected by outliers. That is why it is considered ideal for non-symmetrical data distribution sets.
Limitation of the Median
One disadvantage of the median is that it can?t be determined for categorical nominal data as it is hard to logically order.
The Mean
The mean is the arithmetic average of the data. In other words, the mean is achieved by adding up all the data and then dividing the result by the number of data.
Looking at the age of players again, we have
The added sum of the ages of players is 16+16+16+17+17+18+18+19+20+21+21=199
Now, dividing the added sum by 11, we get 18.09
So, 18.09 is the mean of the data set.
Advantage of the Mean
It can be used for both continuous and discrete sets of data.
Limitations of the Mean
Mean cannot be measured for categorized data because the data cannot be summed.
The mean is influenced by outliers and skewed data as it contains all values of data.
How the Shape of Distribution Affects Central Tendency
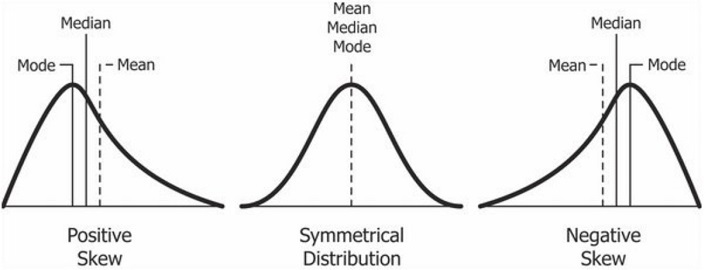
Symmetrical distributions
When a data set is symmetrical, the mode, median, and mean fall at the middle of the distribution. For example, for a larger data set of players' age, the mean, median, and mode may all fall at 18 years when the data is symmetrical.
Skewed Distributions
In the case of skewed distributions, the mode, and median remain the same but the mean is pulled toward the tails. The median is most often the preferred central tendency in the case of skewed distributions because the mean is not in the central position of the distribution.
A positively or right-skewed distribution has a tail that is larger on the right side than the left side of the distribution. It is common in the cases of right-skewed distributions to have the mean pulled towards the right of the distribution. In the case of negative or left-skewed distributions, the mean is pulled toward the left of the distribution.
How Outliers Influence the Measure of Central Tendency
Outliers are extreme values of data that are quite different from the general values of data that can be found in a data set. Outliers alter the results of data analysis and hence must be detected while considering the measure of central tendency.
Considering the example of the age of players
Let's say 90 is an outlier
Considering data with this outlier
We will get a mean of 16+16+16+17+17+18+18+19+20+21+90=268/11 = 24.36 which is quite different from 18.03. So, the results will be erroneous.
There are several regression techniques to identify and remove outliers from data sets. However, in general, the effect of outliers can be minimized if they are confirmed to be extreme and removed from the calculation.
Conclusion
There are many uses for the central values of data sets in economics and statistics because measuring the central value offers an idea of the frequency of the central value that impacts various calculations. It is therefore important to learn and apply.
FAQs
Qns 1. What is meant by the measure of central tendency?
Ans. Also called measures of center or central location, the measure of central tendency refers to a measure of summary that tries to represent the whole data set with a single value that shows the center value of the distribution.
Qns 2. What are the three types of measures of central tendency?
Ans. The mode, median, and mean are three types of measures of central tendency.
Qns 3. Which measure of central tendency is the arithmetic average of the data?
Ans. The mean is the arithmetic average of the data for a data set.

556 Views
