
 Data Structure
 Networking
 RDBMS
RDBMS Operating System
 Java
Java MS Excel
 iOS
iOS HTML
HTML CSS
CSS Android
 Python
 C Programming
 C++
C++ C#
C# MongoDB
 MySQL
MySQL Javascript
 PHP
PHP
- Selected Reading
- UPSC IAS Exams Notes
- Developer's Best Practices
- Questions and Answers
- Effective Resume Writing
- HR Interview Questions
- Computer Glossary
- Who is Who
Matplotlib Backend Differences between Agg and Cairo
| Renderer | File types | Description |
|---|---|---|
| AGG | Png | Raster graphics − high-quality images using the Anti-Grain Geometry engine |
| Cairo | png, ps, pdf, svg | Raster or vector graphics − using the Cairo library |
Steps
- Set the figure size and adjust the padding between and around the subplots.
- Set the backend name as "Agg".
- Create a 5?5 matrix array using numpy.
- Use imshow() method to display data as an image, i.e., on a 2D regular raster.
- To save the figure, use savefig() method.
Example
import matplotlib as mpl
import numpy as np
import matplotlib.pyplot as plt
plt.rcParams["figure.figsize"] = [7.50, 3.50]
plt.rcParams["figure.autolayout"] = True
mpl.use("Agg")
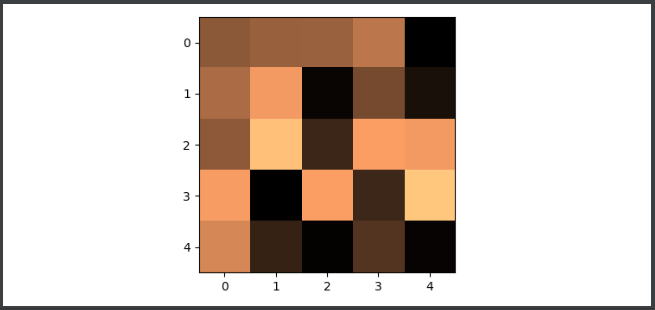
data = np.random.rand(5, 5)
plt.imshow(data, interpolation='nearest', cmap="copper")
plt.savefig('agg.png')
Output

Updated on: 2021-06-02T08:37:49+05:30
651 Views

Advertisements