
 Data Structure
 Networking
 RDBMS
RDBMS Operating System
 Java
Java MS Excel
 iOS
iOS HTML
HTML CSS
CSS Android
 Python
 C Programming
 C++
C++ C#
C# MongoDB
 MySQL
MySQL Javascript
 PHP
PHP
- Selected Reading
- UPSC IAS Exams Notes
- Developer's Best Practices
- Questions and Answers
- Effective Resume Writing
- HR Interview Questions
- Computer Glossary
- Who is Who
JavaScript Chart.js
Chart.js is an open source JavaScript library. Using Chart.js, add animated, interactive graphs on your website.
Following is the code for Chart.js library in JavaScript −
Example
<!DOCTYPE html>
<html>
<head>
<script
<script src="https://cdn.jsdelivr.net/npm/chart.js@2.8.0"></script>
</script>
</head>
<body>
<canvas id="myChart" width="500" height="300"></canvas>
<script type="text/javascript">
var ctx = document.getElementById("myChart");
var myChart = new Chart(ctx, {
type: 'bar',
data: {
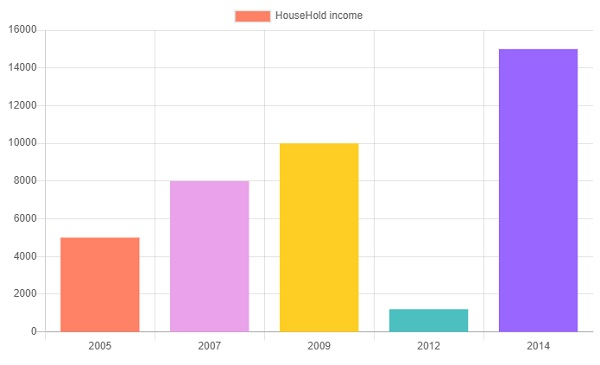
labels: ["2005", "2007" , "2009" , "2012", "2014"],
datasets: [
{ label: 'HouseHold income',
data: [5000,8000,10000,1200,15000],
backgroundColor :['rgba(255, 129, 102, 1)',
'rgba(234, 162, 235, 1)',
'rgba(255, 206, 36, 1)',
'rgba(75, 192, 192, 1)',
'rgba(153, 102, 255, 1)',
],
}
]
},
options: {
scales: {
yAxes: [{
ticks: {
beginAtZero:true
}
}]
}
}
});
</script>
</body>
</html>
Output

Updated on: 2020-05-07T13:50:15+05:30
529 Views

Advertisements