
 Data Structure
 Networking
 RDBMS
RDBMS Operating System
 Java
Java MS Excel
 iOS
iOS HTML
HTML CSS
CSS Android
 Python
 C Programming
 C++
C++ C#
C# MongoDB
 MySQL
MySQL Javascript
 PHP
PHP
- Selected Reading
- UPSC IAS Exams Notes
- Developer's Best Practices
- Questions and Answers
- Effective Resume Writing
- HR Interview Questions
- Computer Glossary
- Who is Who
Increase the distance between the title and the plot in Matplotlib
To increase the distance between the title and the plot in matplotlib, we can take the following steps −
Create point x using numpy.
Create point y using numpy sin.
Set the title of the plot. After changing the value y (in argument), we can increase or decrease the distance between the title and the plot.
Plot x and y points using the plot() method, where color is red and line width is 2.
Ti display the figure, use the show() method.
Example
import numpy as np
from matplotlib import pyplot as plt
plt.rcParams["figure.figsize"] = [7.50, 3.50]
plt.rcParams["figure.autolayout"] = True
x = np.linspace(1, 10, 1000)
y = np.sin(x)
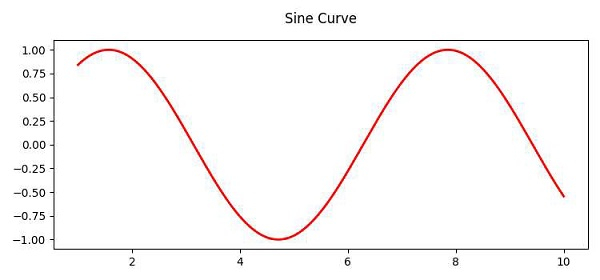
ttl = plt.title('Sine Curve', y=1.05)
plt.plot(x, y, c="red", lw=2)
plt.show()
Output

Updated on: 2021-04-09T12:31:23+05:30
5K+ Views

Advertisements