
Article Categories
- All Categories
-
 Data Structure
-
 Networking
-
 RDBMS
RDBMS
-
 Operating System
-
 Java
Java
-
 MS Excel
-
 iOS
iOS
-
 HTML
HTML
-
 CSS
CSS
-
 Android
-
 Python
-
 C Programming
-
 C++
C++
-
 C#
C#
-
 MongoDB
-
 MySQL
MySQL
-
 Javascript
-
 PHP
PHP
-
 Economics & Finance
Selected Reading
Implementing K-means clustering of Diabetes dataset with SciPy library
The Pima Indian Diabetes dataset, which we will be using here, is originally from the National Institute of Diabetes and Digestive and Kidney Diseases. Based on the following diagnostic factors, this dataset can be used to place a patient in ether diabetic cluster or non-diabetic cluster −
Pregnancies
Glucose
Blood Pressure
Skin Thickness
Insulin
BMI
Diabetes Pedigree Function
Age
You can get this dataset in .CSV format from Kaggle website.
Example
The example below will use SciPy library to create two clusters namely diabetic and non-diabetic from the Pima Indian diabetes dataset.
#importing the required Python libraries:
import matplotlib.pyplot as plt
import numpy as np
from scipy.cluster.vq import whiten, kmeans, vq
#Loading the dataset:
dataset = np.loadtxt(r"{your path}\pima-indians-diabetes.csv", delimiter=",")
# Printing the data after excluding the outcome column
dataset = dataset[:, 0:8]
print("Data :<br>", dataset, "<br>")
#Normalizing the data:
dataset = whiten(dataset)
# generating code book by computing K-Means with K = 2 (2 clusters i.e., diabetic, and non-diabetic clusters)
centroids, mean_dist = kmeans(dataset, 2)
print("Code book :<br>", centroids, "<br>")
clusters, dist = vq(dataset, centroids)
print("Clusters :<br>", clusters, "<br>")
# forming cluster of non-diabetic patients
non_diabetic = list(clusters).count(0)
# forming cluster of diabetic patients
diabetic = list(clusters).count(1)
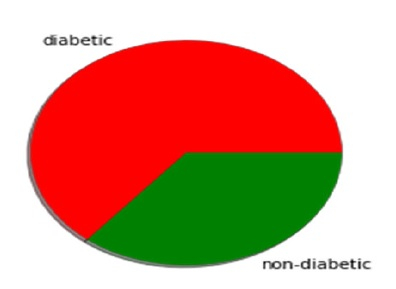
#Plotting the pie chart having clusters
x_axis = []
x_axis.append(diabetic)
x_axis.append(non_diabetic)
colors = ['red', 'green']
print("Total number of diabetic patients : " + str(x_axis[0]) + "\nTotal number non-diabetic patients : " + str(x_axis[1]))
y = ['diabetic', 'non-diabetic']
plt.pie(x_axis, labels=y, colors=colors, shadow='false')
plt.show()
Output
Data :
[[ 6. 148. 72. ... 33.6 0.627 50. ]
[ 1. 85. 66. ... 26.6 0.351 31. ]
[ 8. 183. 64. ... 23.3 0.672 32. ]
...
[ 5. 121. 72. ... 26.2 0.245 30. ]
[ 1. 126. 60. ... 30.1 0.349 47. ]
[ 1. 93. 70. ... 30.4 0.315 23. ]]

Code book :
[[2.08198148 4.17698255 3.96280983 1.04984582 0.56968574 4.13266474
1.40143319 3.86427413]
[0.6114727 3.56175537 3.35245694 1.42268776 0.76239717 4.01974705
1.43848683 2.24399453]]

Clusters :
[0 1 0 1 1 1 1 1 0 0 0 0 0 0 0 1 1 0 1 1 1 0 0 0 0 0 0 1 0 0 0 1 1 0 0 1
0
0 1 0 1 0 0 0 0 1 1 1 1 1 1 1 1 0 0 1 0 1 0 1 1 0 1 1 0 1 1 0 1 1 1 1 0 1
1 1 0 1 1 1 1 1 0 1 0 1 0 1 0 1 1 1 0 0 1 0 1 1 1 1 1 1 1 1 1 1 1 1 1 1 1
0 1 1 0 0 0 1 1 1 1 1 1 0 1 1 1 1 1 0 0 0 1 0 1 1 1 1 1 1 0 0 1 0 1 1 0 1
0 1 1 1 0 1 0 0 1 1 1 0 0 0 1 1 1 0 1 1 1 1 0 1 1 1 1 0 0 1 0 0 0 1 1 1 0
0 0 1 0 1 1 0 0 0 0 1 1 1 1 1 1 1 1 1 0 1 0 0 1 0 1 1 0 1 0 0 1 1 1 0 1 0
1 0 1 1 1 1 1 1 1 0 1 1 1 0 0 1 0 1 1 1 1 1 1 0 0 1 0 1 0 1 1 1 0 1 1 1 1
0 0 1 1 0 1 0 1 1 1 1 0 1 0 1 0 1 1 1 0 1 1 0 0 0 0 0 1 1 1 1 1 1 1 1 0 1
1 1 0 0 1 1 1 0 0 1 0 1 1 1 0 1 1 1 0 1 1 0 1 0 1 1 1 0 1 1 1 0 1 0 0 1 1
0 1 1 1 0 0 0 1 1 1 0 0 0 1 1 1 1 1 0 1 1 1 0 1 0 0 1 1 0 0 0 1 1 0 1 1 0
1 1 1 1 1 0 1 1 0 1 1 1 1 1 1 1 1 0 0 1 1 0 1 1 0 1 1 1 1 1 1 0 0 0 0 1 0
1 0 1 1 1 1 1 1 1 1 0 1 1 1 1 1 1 0 1 1 1 1 1 1 1 1 1 1 1 0 0 1 0 0 1 1 0
1 1 1 1 1 1 1 1 1 0 1 0 0 1 0 0 0 1 0 1 0 1 1 1 0 1 1 1 1 0 1 0 1 0 0 0 1
1 1 1 1 1 1 0 1 0 1 1 1 0 1 0 1 1 0 0 1 1 1 0 1 0 1 1 1 0 0 1 0 1 1 1 0 0
0 0 1 1 1 0 1 1 1 1 1 1 1 1 1 1 1 1 0 0 1 1 0 1 0 1 1 0 0 1 0 0 1 1 0 1 1
0 1 0 0 0 0 1 1 1 1 1 1 0 0 1 1 1 1 1 1 1 1 1 0 0 1 1 0 0 0 1 0 1 0 1 0 1
0 1 1 1 1 1 0 1 1 1 1 0 1 1 1 1 1 1 1 1 0 1 0 1 0 1 0 1 1 1 0 1 1 1 1 1 0
1 0 1 1 1 0 0 0 1 1 1 1 1 0 1 1 1 1 1 0 1 1 1 1 1 1 1 1 1 0 1 0 1 0 0 0 1
0 0 0 0 0 1 0 1 0 0 0 1 1 1 1 1 1 1 0 1 1 1 1 0 0 0 1 0 1 0 1 1 1 1 1 0 0
1 1 1 1 1 0 1 1 0 0 1 1 0 1 0 1 0 1 1 1 0 0 1 1 1 1 1 1 0 1 1 0 1 1 0 1 1
0 1 1 0 0 0 1 1 0 0 1 1 1 1 0 1 0 0 1 0 1 0 0 0 1 1 0 1]

Total number of diabetic patients : 492
Total number non-diabetic patients : 276

Updated on: 2021-12-14T08:59:17+05:30
974 Views

Advertisements