
 Data Structure
 Networking
 RDBMS
RDBMS Operating System
 Java
Java MS Excel
 iOS
iOS HTML
HTML CSS
CSS Android
 Python
 C Programming
 C++
C++ C#
C# MongoDB
 MySQL
MySQL Javascript
 PHP
PHP
- Selected Reading
- UPSC IAS Exams Notes
- Developer's Best Practices
- Questions and Answers
- Effective Resume Writing
- HR Interview Questions
- Computer Glossary
- Who is Who
Implement mean shift algorithm in Python
There are many types of clustering algorithms in Machine Learning. These algorithms can be implemented in Python. In this article, let us discuss and implement the ‘Mean−Shift’ algorithm using Python. It is a clustering algorithm that is used as an unsupervised learning method.
In this algorithm, no assumptions are made. This implies that it a non−parametric algorithm. This algorithm assigns data points to certain clusters iteratively, which is done by shifting these data points towards highest density of data points.
This high density of data points is known as the centroid of the cluster. The different between Mean shift algorithm and K means clustering is that in former (K−means) the number of clusters needs to be specified in advance.
This is because the number of clusters is found with the help of K means algorithm based on the data present.
Let us understand the steps in Mean-shift algorithm −
The data points are assigned to a cluster of its own.
Then, the centroids of these clusters are determined.
The location of these centroids is updated iteratively.
Next, the process moves to higher density regions.
Once the centroids reach a position where they can’t move further, the process stops.
Let us understand how it can be implemented in Python, using scikit−learn −
Example
import numpy as np
from sklearn.cluster import MeanShift
import matplotlib.pyplot as plt
from matplotlib import style
style.use("ggplot")
from sklearn.datasets.samples_generator import make_blobs
centers = [[3,3,1],[4,5,5],[11,10,10]]
X, _ = make_blobs(n_samples = 950, centers = centers, cluster_std = 0.89)
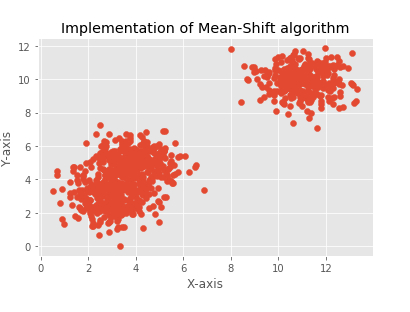
plt.title("Implementation of Mean-Shift algorithm")
plt.xlabel("X-axis")
plt.ylabel("Y-axis")
plt.scatter(X[:,0],X[:,1])
plt.show()
ms = MeanShift()
ms.fit(X)
labels = ms.labels_
clusterCent = ms.cluster_centers_
print(clusterCent)
numCluster = len(np.unique(labels))
print("Estimated clusters:", numCluster)
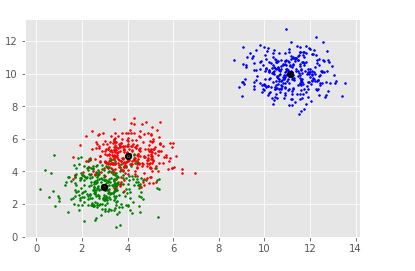
colors = 10*['r.','g.','b.','c.','k.','y.','m.']
for i in range(len(X)):
plt.plot(X[i][0], X[i][1], colors[labels[i]], markersize = 3)
plt.scatter(clusterCent[:,0],clusterCent[:,1],
marker=".",color='k', s=20, linewidths = 5, zorder=10)
plt.show()
Output
[[ 3.05250924 3.03734994 1.06159541]
[ 3.92913017 4.99956874 4.86668482]
[10.99127523 10.02361122 10.00084718]]
Estimated clusters: 3
Explanation
The required packages are imported and its alias is defined for ease of use.
The ‘ggplot’ is specified to the ‘use’ function present in ‘style’ class.
The ‘make_blobs’ function is used to create clusters of data.
The set_xlabel, set_ylabel and set_title functions are used to provide labels for ‘X’ axis, ‘Y’ axis and title.
The ‘MeanShift’ function is called, and assigned to a variable.
The data is fit to the model.
The labels and number of clusters is defined.
This data is plotted, and the scatter plot for the data fit to the model is also displayed.
It is shown on the console using the ‘show’ function.

514 Views
