
Article Categories
- All Categories
-
 Data Structure
-
 Networking
-
 RDBMS
RDBMS
-
 Operating System
-
 Java
Java
-
 MS Excel
-
 iOS
iOS
-
 HTML
HTML
-
 CSS
CSS
-
 Android
-
 Python
-
 C Programming
-
 C++
C++
-
 C#
C#
-
 MongoDB
-
 MySQL
MySQL
-
 Javascript
-
 PHP
PHP
-
 Economics & Finance
Selected Reading
How to write a common title for par(mfrow) plots in R?
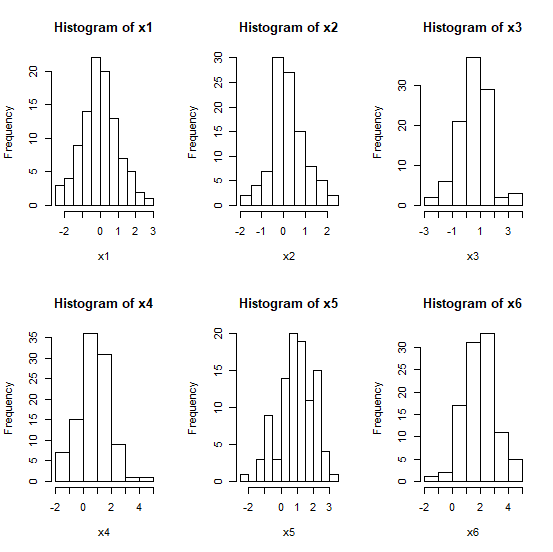
We can create multiple plots using par(mfrow) on a single plot window in R. It might be possible that all of these plots are different or same as well. Irrespective of the type of plots, we can give a common title to all the plots. This can be a situation where we want to show, say, scatterplots, and histograms of few variables but the object of our analysis is fixed. To write a common title between plots in the plot window we can use mtext and adjust the title position by changing line argument.
Example
set.seed(100)
x1<-rnorm(100)
x2<-rnorm(100,0.2)
x3<-rnorm(100,0.5)
x4<-rnorm(100,0.8)
x5<-rnorm(100,1.1)
x6<-rnorm(100,1.8)
par(mfrow=c(2,3))
hist(x1)
hist(x2)
hist(x3)
hist(x4)
hist(x5)
hist(x6)
Output
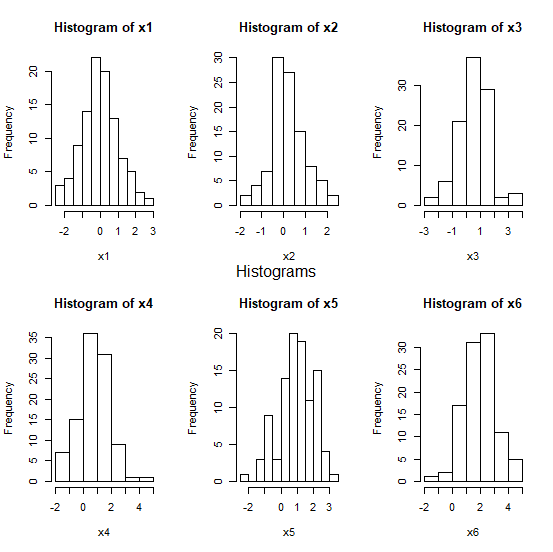
The code to write a common title “Histograms” between the top and bottom histograms −
Example
mtext("Histograms",side=3,line=-22,outer=TRUE)
Output

Updated on: 2020-08-21T12:12:10+05:30
2K+ Views

Advertisements