
 Data Structure
 Networking
 RDBMS
RDBMS Operating System
 Java
Java MS Excel
 iOS
iOS HTML
HTML CSS
CSS Android
 Python
 C Programming
 C++
C++ C#
C# MongoDB
 MySQL
MySQL Javascript
 PHP
PHP
- Selected Reading
- UPSC IAS Exams Notes
- Developer's Best Practices
- Questions and Answers
- Effective Resume Writing
- HR Interview Questions
- Computer Glossary
- Who is Who
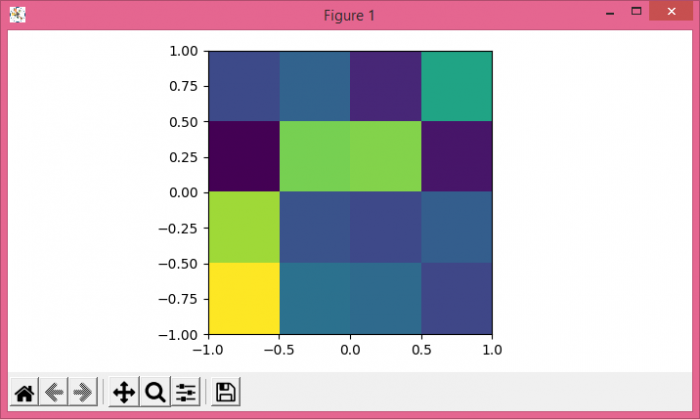
How to use 'extent' in matplotlib.pyplot.imshow?
To use extent in matplotlib imshow(), we can use extent [left, right, bottom, top].
Steps
- Create random data using numpy.
- Display the data as an image, i.e., on a 2D regular raster with data and extent [−1, 1, −1, 1] arguments.
- To display the figure, use show() method.
Example
import numpy as np
from matplotlib import pyplot as plt
plt.rcParams["figure.figsize"] = [7.00, 3.50]
plt.rcParams["figure.autolayout"] = True
data = np.random.rand(4, 4)
plt.imshow(data, extent=[-1, 1, -1, 1])
plt.show()
Output

Updated on: 2021-05-06T13:51:59+05:30
3K+ Views

Advertisements