
 Data Structure
 Networking
 RDBMS
RDBMS Operating System
 Java
Java MS Excel
 iOS
iOS HTML
HTML CSS
CSS Android
 Python
 C Programming
 C++
C++ C#
C# MongoDB
 MySQL
MySQL Javascript
 PHP
PHP
- Selected Reading
- UPSC IAS Exams Notes
- Developer's Best Practices
- Questions and Answers
- Effective Resume Writing
- HR Interview Questions
- Computer Glossary
- Who is Who
How to use ax.get_ylim() in matplotlib?
To use ax.get_ylim() method in matplotlib, we can take the following steps.
Steps
Set the figure size and adjust the padding between and around the subplots.
Create a new figure or activate an existing figure.
Add an 'ax' to the figure as part of a subplot arrangement.
Create random data points using numpy.
Plot y data points using plot() method.
Use ax.get_ylim() method to print it.
To display the figure, use Show() method.
Example
import numpy as np
from matplotlib import pyplot as plt

plt.rcParams["figure.figsize"] = [7.00, 3.50]
plt.rcParams["figure.autolayout"] = True

fig = plt.figure()

# Add an axes to the figure
ax = fig.add_subplot(1, 1, 1)

# Create random data points using numpy
y = np.random.rand(10)

# Plot the data points
ax.plot(y, 'b')

# Print the data points using ax.get_ylim
print("ylim:", ax.get_ylim())

plt.show()
Output
It will produce the following output −
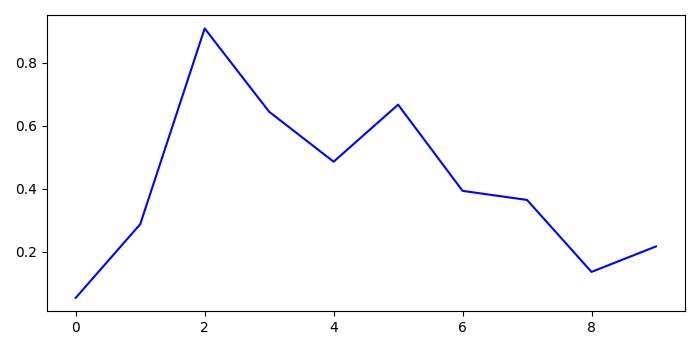
On the console, you will get the ylim values−
ylim: (0.011546568085342858, 1.0373520884865295)

Updated on: 2021-10-08T12:14:22+05:30
655 Views

Advertisements