
Article Categories
- All Categories
-
 Data Structure
-
 Networking
-
 RDBMS
RDBMS
-
 Operating System
-
 Java
Java
-
 MS Excel
-
 iOS
iOS
-
 HTML
HTML
-
 CSS
CSS
-
 Android
-
 Python
-
 C Programming
-
 C++
C++
-
 C#
C#
-
 MongoDB
-
 MySQL
MySQL
-
 Javascript
-
 PHP
PHP
-
 Economics & Finance
Selected Reading
How to turn on minor ticks only on the y-axis Matplotlib?
First, we can create fig, ax using subplots() and then, we can plot the lines. After that, using ax.yaxis.set_minor_locator(tck.AutoMinorLocator()), we can turn on the minor ticks.
Steps
Create fig and ax variables using subplots method, where default nrows and ncols are 1.
Plot the line using two lists.
Set the locator of the minor ticker.
Dynamically find minor tick positions based on the positions of major ticks. The scale must be linear with major ticks evenly spaced.
Using plt.show() method, we can show the figure.
Example
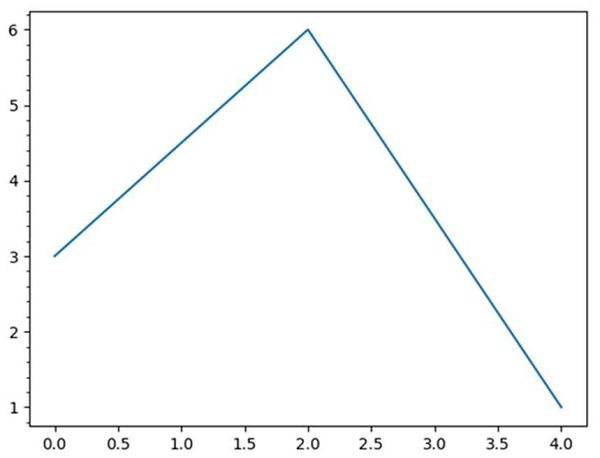
import matplotlib.pyplot as plt
import matplotlib.ticker as tck
fig, ax = plt.subplots()
plt.plot([0, 2, 4], [3, 6, 1])
ax.yaxis.set_minor_locator(tck.AutoMinorLocator())
plt.show()
Output

Updated on: 2021-03-17T08:02:26+05:30
2K+ Views

Advertisements