
Article Categories
- All Categories
-
 Data Structure
-
 Networking
-
 RDBMS
RDBMS
-
 Operating System
-
 Java
Java
-
 MS Excel
-
 iOS
iOS
-
 HTML
HTML
-
 CSS
CSS
-
 Android
-
 Python
-
 C Programming
-
 C++
C++
-
 C#
C#
-
 MongoDB
-
 MySQL
MySQL
-
 Javascript
-
 PHP
PHP
-
 Economics & Finance
Selected Reading
How to turn off the upper/right axis tick marks in Matplotlib?
To turn off the upper or right axis ticks marks in matplotlib, we can make a custom dictionary visible_ticks and turn off the flag.
Steps
- Set the figure size and adjust the padding between and around the subplots.
- Create x and y data points using numpy.
- Plot x and y data points using plot() method.
- Make a dictionary to turn off the axis ticks marks.
- To display the figure, use show() method.
Example
import numpy as np
import matplotlib.pyplot as plt
plt.rcParams["figure.figsize"] = [7.50, 3.50]
plt.rcParams["figure.autolayout"] = True
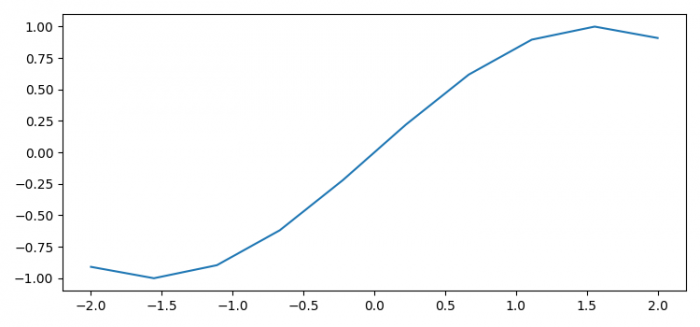
x = np.linspace(-2, 2, 10)
y = np.sin(x)
plt.plot(x, y)
visible_ticks = {
"top": False,
"right": False
}
plt.tick_params(axis="x", which="both", **visible_ticks)
plt.show()
Output

Updated on: 2021-06-02T08:50:54+05:30
1K+ Views

Advertisements