
 Data Structure
 Networking
 RDBMS
RDBMS Operating System
 Java
Java MS Excel
 iOS
iOS HTML
HTML CSS
CSS Android
 Python
 C Programming
 C++
C++ C#
C# MongoDB
 MySQL
MySQL Javascript
 PHP
PHP
- Selected Reading
- UPSC IAS Exams Notes
- Developer's Best Practices
- Questions and Answers
- Effective Resume Writing
- HR Interview Questions
- Computer Glossary
- Who is Who
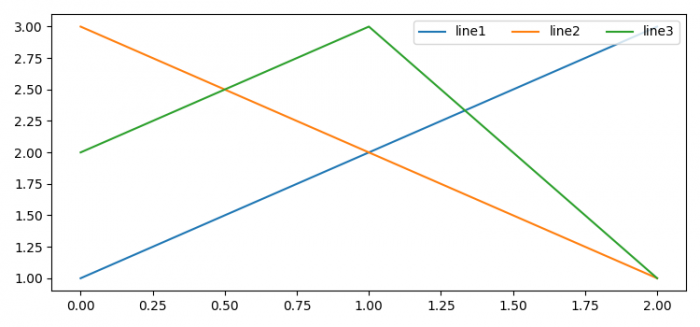
How to show legend elements horizontally in Matplotlib?
To show legend elements horizontally, we can take the following steps
- Set the figure size and adjust the padding between and around the subplots.
- Using plot() method, plot lines with the labels line1, line2 and line3.
- Place a legend on the figure using legend() method, with number of labels for ncol value in the argument.
- To display the figure, use show() method.
Example
from matplotlib import pyplot as plt

plt.rcParams["figure.figsize"] = [7.50, 3.50]
plt.rcParams["figure.autolayout"] = True

line1, = plt.plot([1, 2, 3], label="line1")
line2, = plt.plot([3, 2, 1], label="line2")
line3, = plt.plot([2, 3, 1], label="line3")
plt.legend(ncol=3, loc="upper right")
plt.show()
Output

Updated on: 2021-06-02T08:47:03+05:30
7K+ Views

Advertisements