
Article Categories
- All Categories
-
 Data Structure
-
 Networking
-
 RDBMS
RDBMS
-
 Operating System
-
 Java
Java
-
 MS Excel
-
 iOS
iOS
-
 HTML
HTML
-
 CSS
CSS
-
 Android
-
 Python
-
 C Programming
-
 C++
C++
-
 C#
C#
-
 MongoDB
-
 MySQL
MySQL
-
 Javascript
-
 PHP
PHP
Selected Reading
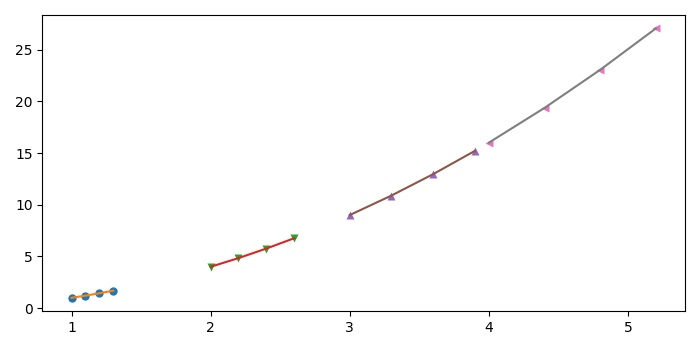
How to set same color for markers and lines in a Matplotlib plot loop?
To set the same color for markers and lines in a matplotlib, we can take the following Steps −
Initialize m, n and x data points using numpy.
Create a new figure or activate an existing figure using figure() method.
Clear the figure using clf() method.
Add a subplot to the current figure using subplot() method.
Get a marker from a iterable marker type.
Iterate a range from 1 to n.
Plot the lines and markers in the loop using plot() method with the same marker and colors for a line.
To display the figure, use show() method.
Example
import numpy as np
import itertools
from matplotlib import pyplot as plt
plt.rcParams["figure.figsize"] = [7.00, 3.50]
plt.rcParams["figure.autolayout"] = True
m = 5
n = 5
x = np.zeros(shape=(m, n))
plt.figure()
plt.clf()
plt.subplot(111)
marker = itertools.cycle(('o', 'v', '^', '<', '>', 's', '8', 'p'))
for i in range(1, n):
   x = np.dot(i, [1, 1.1, 1.2, 1.3])
   y = x ** 2
   plt.plot(x, y, linestyle='', markeredgecolor='none', marker=next(marker), alpha=1)
   plt.plot(x, y, linestyle='-')
plt.show()
Output

Updated on: 2021-05-15T12:23:17+05:30
2K+ Views

Advertisements