
Article Categories
- All Categories
-
 Data Structure
-
 Networking
-
 RDBMS
RDBMS
-
 Operating System
-
 Java
Java
-
 MS Excel
-
 iOS
iOS
-
 HTML
HTML
-
 CSS
CSS
-
 Android
-
 Python
-
 C Programming
-
 C++
C++
-
 C#
C#
-
 MongoDB
-
 MySQL
MySQL
-
 Javascript
-
 PHP
PHP
-
 Economics & Finance
Selected Reading
How to set legend marker size and alpha in Matplotlib?
To set legend marker size and alpha in matplotlib, we can take the following steps −
Steps
Set the figure size and adjust the padding between and around the subplots.
Initialize a variable N to store the number of sample data.
Plot the x and y data points with marker="*".
Place a legend on the figure.
Set the marker size and alpha value of the marker.
To display the figure, use show() method.
Example
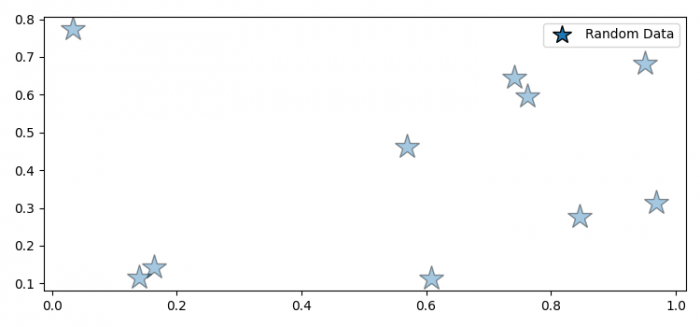
import matplotlib.pyplot as plt
import numpy as np

plt.rcParams["figure.figsize"] = [7.50, 3.50]
plt.rcParams["figure.autolayout"] = True

N = 10

x = np.random.rand(N)
y = np.random.rand(N)

line, = plt.plot(x, y, marker='*', markersize=20, markeredgecolor='black',
   alpha=0.4, ls='none', label='Random Data')

legend = plt.legend(loc='upper right')
legend.legendHandles[0]._legmarker.set_markersize(15)
legend.legendHandles[0]._legmarker.set_alpha(1)

plt.show()
Output
It will produce the following output −

Updated on: 2022-02-02T11:21:30+05:30
8K+ Views

Advertisements