
Article Categories
- All Categories
-
 Data Structure
-
 Networking
-
 RDBMS
RDBMS
-
 Operating System
-
 Java
Java
-
 MS Excel
-
 iOS
iOS
-
 HTML
HTML
-
 CSS
CSS
-
 Android
-
 Python
-
 C Programming
-
 C++
C++
-
 C#
C#
-
 MongoDB
-
 MySQL
MySQL
-
 Javascript
-
 PHP
PHP
Selected Reading
How to set a Matplotlib rectangle edge to outside of specified width?
To set a Matplotlib rectangle edge to outside of specified width, we can take the following steps −
- Set the figure size and adjust the padding between and around the subplots.
- Create a new figure or activate an existing figure.
- Add an ax to the figure as part of a subplot arrangement.
- Initialize a variable line_width to set the rectangle outside of specified width. Use the variables xy, w and h for rectangle's center, width and height.
- Get a rectangle instance, with xy anchor points and its height and width.
- Get the offset transformbox instance.
- Add an artist patch, r (Step 5).
- Get the container for an OffsetBox instance.
- Add an annotation box, ab, to the container box.
- To display the figure, use show() method.
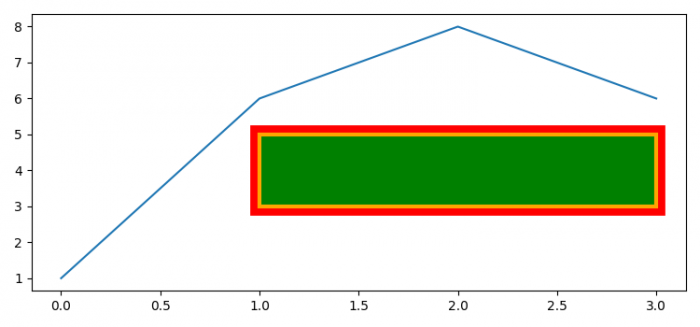
Example
import matplotlib.pyplot as plt
from matplotlib.patches import Rectangle
from matplotlib.offsetbox import AnnotationBbox, AuxTransformBox

plt.rcParams["figure.figsize"] = [7.50, 3.50]
plt.rcParams["figure.autolayout"] = True

fig = plt.figure()

ax = fig.add_subplot(111)
ax.plot([1, 6, 8, 6])

line_width = 7
xy, w, h = (1, 3), 2, 2
r = Rectangle(xy, w, h, fc='green', ec='orange', lw=3)

offsetbox = AuxTransformBox(ax.transData)
offsetbox.add_artist(r)

ab = AnnotationBbox(offsetbox, (xy[0] + w /, xy[1] + w /),
   boxcoords="data", pad=0.52, fontsize=line_width,
   bboxprops=dict(facecolor="none", edgecolor='r',
   lw=line_width))
ax.add_artist(ab)

plt.show()
Output


Updated on: 2021-08-04T12:08:08+05:30
614 Views

Advertisements