
Article Categories
- All Categories
-
 Data Structure
-
 Networking
-
 RDBMS
RDBMS
-
 Operating System
-
 Java
Java
-
 MS Excel
-
 iOS
iOS
-
 HTML
HTML
-
 CSS
CSS
-
 Android
-
 Python
-
 C Programming
-
 C++
C++
-
 C#
C#
-
 MongoDB
-
 MySQL
MySQL
-
 Javascript
-
 PHP
PHP
How to rotate tick labels in a subplot in Matplotlib?
To rotate tick labels in a subplot, we can use set_xticklabels() or set_yticklabels() with rotation argument in the method.
Create a list of numbers (x) that can be used to tick the axes.
Get the axis using subplot() that helps to add a subplot to the current figure.
Set ticks on the X and Y axes using set_xticks and set_yticks methods, respectively, and the list x (from step 1).
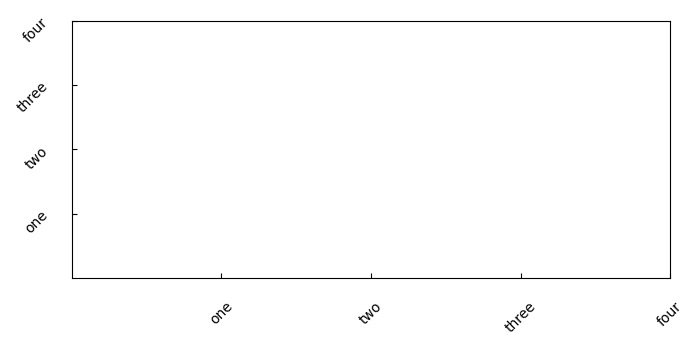
Set tick labels with label lists (["one", "two", "three", "four"]) and rotation=45 using set_xticklabels() and set_yticklabels().
To add space between axes and tick labels, we can use tick_params() method with pad argument that helps to add space. The argument direction(in) helps to put the ticks inside the axes. And, apply axis(both) parameters on both the axes.
To show the figure, use plt.show() method.
Example
import matplotlib.pyplot as plt
plt.rcParams["figure.figsize"] = [7.00, 3.50]
plt.rcParams["figure.autolayout"] = True
x = [1, 2, 3, 4]
ax1 = plt.subplot()
ax1.set_xticks(x)
ax1.set_yticks(x)
ax1.set_xticklabels(["one", "two", "three", "four"], rotation=45)
ax1.set_yticklabels(["one", "two", "three", "four"], rotation=45)
ax1.tick_params(axis="both", direction="in", pad=15)
plt.show()
Output

17K+ Views
