
Article Categories
- All Categories
-
 Data Structure
-
 Networking
-
 RDBMS
RDBMS
-
 Operating System
-
 Java
Java
-
 MS Excel
-
 iOS
iOS
-
 HTML
HTML
-
 CSS
CSS
-
 Android
-
 Python
-
 C Programming
-
 C++
C++
-
 C#
C#
-
 MongoDB
-
 MySQL
MySQL
-
 Javascript
-
 PHP
PHP
-
 Economics & Finance
Selected Reading
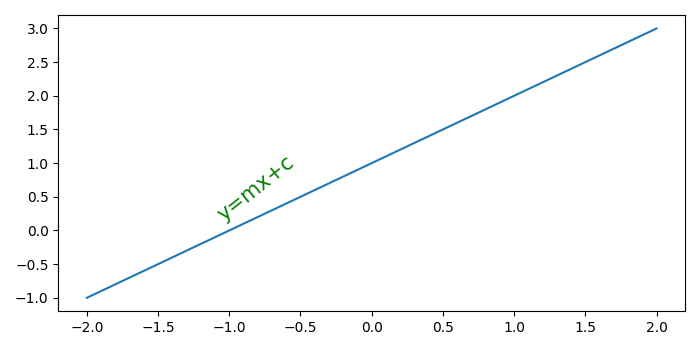
How to rotate Matplotlib annotation to match a line?
To rotate matplotlib annotation to match a line, we can take the following steps−
- Create a new figure or activate an existing figure using figure() method.
- Add an '~.axes.Axes' to the figure as part of a subplot arrangement using add_subplot() method.
- Initialize the variables, m (slope) and c (intercept).
- Create x and y data points using numpy.
- Calculate theta to make text rotation.
- Plot the line using plot() method with x and y.
- Place text on the line using text() method.
- To display the figure, use show() method.
Example
import numpy as np
from matplotlib import pyplot as plt
plt.rcParams["figure.figsize"] = [7.00, 3.50]
plt.rcParams["figure.autolayout"] = True
fig = plt.figure()
ax = fig.add_subplot()
m = 1
c = 1
x = np.linspace(-2, 2, 10)
y = m*x + c
theta = np.arctan(m)
line, = ax.plot(x, y)
ax.text(x=x[2], y=y[2]+.25, s="y=mx+c", rotation=180.0*(1-theta), fontsize=15, color='green')
plt.show()
Output

Updated on: 2021-05-15T12:16:25+05:30
4K+ Views

Advertisements