
 Data Structure
 Networking
 RDBMS
RDBMS Operating System
 Java
Java MS Excel
 iOS
iOS HTML
HTML CSS
CSS Android
 Python
 C Programming
 C++
C++ C#
C# MongoDB
 MySQL
MySQL Javascript
 PHP
PHP
- Selected Reading
- UPSC IAS Exams Notes
- Developer's Best Practices
- Questions and Answers
- Effective Resume Writing
- HR Interview Questions
- Computer Glossary
- Who is Who
How to rotate a simple matplotlib Axes?
To rotate a simple matplotlib axes, we can take the following steps −
- Import the required packages −
import matplotlib.pyplot as plt
from matplotlib.transforms import Affine2D
import mpl_toolkits.axisartist.floating_axes as floating_axes
- Set the figure size and adjust the padding between and around the subplots.
- Create a new figure or activate an existing figure.
- Make a tuple of axes extremes.
- Add a mutable 2D affine transformation, "t". Add a rotation (in degrees) to this transform in place.
- Add a transform from the source (curved) coordinate to target (rectilinear) coordinate.
- Add a floating axes "h" with the current figure with GridHelperCurveLinear() instance.
- Add an 'ax' to the figure as part of a subplot arrangement.
- To display the figure, use show() method.
Example
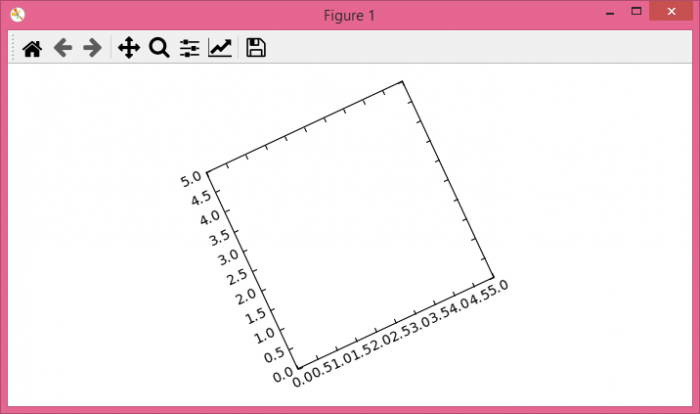
# import the packages
import matplotlib.pyplot as plt
from matplotlib.transforms import Affine2D
import mpl_toolkits.axisartist.floating_axes as floating_axes

# set the figure size
plt.rcParams["figure.figsize"] = [7.00, 3.50]
plt.rcParams["figure.autolayout"] = True

# plot the figure
fig = plt.figure()

scales = (0, 5, 0, 5)

# Add 2D affine transformation
t = Affine2D().rotate_deg(25)

# Add floating axes
h = floating_axes.GridHelperCurveLinear(t, scales)
ax = floating_axes.FloatingSubplot(fig, 111, grid_helper=h)

fig.add_subplot(ax)

plt.show()
Output
It will produce the following output −

Updated on: 2021-09-20T09:18:12+05:30
12K+ Views

Advertisements