
Article Categories
- All Categories
-
 Data Structure
-
 Networking
-
 RDBMS
RDBMS
-
 Operating System
-
 Java
Java
-
 MS Excel
-
 iOS
iOS
-
 HTML
HTML
-
 CSS
CSS
-
 Android
-
 Python
-
 C Programming
-
 C++
C++
-
 C#
C#
-
 MongoDB
-
 MySQL
MySQL
-
 Javascript
-
 PHP
PHP
Selected Reading
How to replace auto-labelled relative values by absolute values in Matplotlib?
To replace auto-labelled relayive values by absolute values in matplotlib, we can use autopct=lambda p:
Steps
- Set the figure size and adjust the padding between and around the subplots.
- Make lists of labels, fractions, explode position and get the sum of fractions to calculate the percentage.
- Make a pie chart using labels, fracs and explode with autopct=lambda p:
. - To display the figure, use show() method.
Example
import matplotlib.pyplot as plt
plt.rcParams["figure.figsize"] = [7.50, 3.50]
plt.rcParams["figure.autolayout"] = True
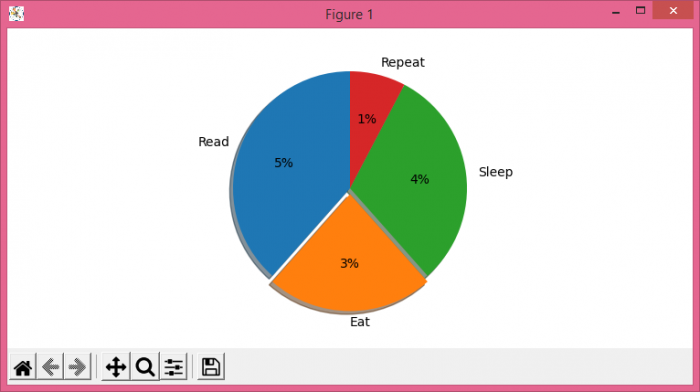
labels = ('Read', 'Eat', 'Sleep', 'Repeat')
fracs = [5, 3, 4, 1]
total = sum(fracs)
explode = (0, 0.05, 0, 0)
plt.pie(fracs, explode=explode, labels=labels,
autopct=lambda p: '{:.0f}%'.format(p * total / 100),
shadow=True, startangle=90)
plt.show()
Output

Updated on: 2021-06-15T13:18:13+05:30
802 Views

Advertisements