
Article Categories
- All Categories
-
 Data Structure
-
 Networking
-
 RDBMS
RDBMS
-
 Operating System
-
 Java
Java
-
 MS Excel
-
 iOS
iOS
-
 HTML
HTML
-
 CSS
CSS
-
 Android
-
 Python
-
 C Programming
-
 C++
C++
-
 C#
C#
-
 MongoDB
-
 MySQL
MySQL
-
 Javascript
-
 PHP
PHP
-
 Economics & Finance
Selected Reading
How to remove Y-axis labels in R?
When we create a plot in R, the Y-axis labels are automatically generated and if we want to remove those labels, the plot function can help us. For this purpose, we need to set ylab argument of plot function to blank as ylab="" and yaxt="n" to remove the axis title. This is a method of base R only, not with ggplot2 package.
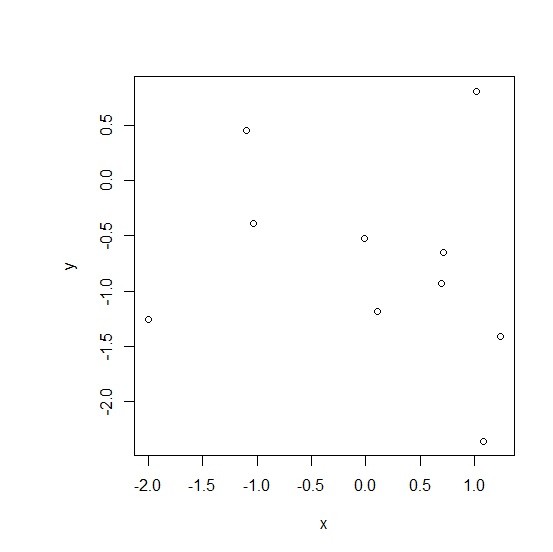
Example
xOutput
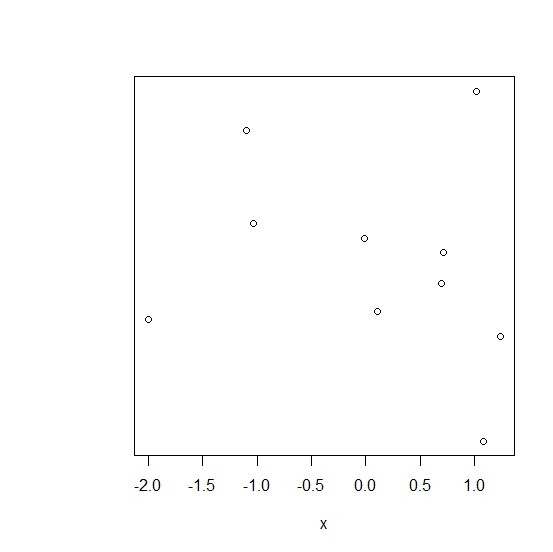
Example
plot(x,y,ylab="",yaxt="n")Output

Updated on: 2021-02-06T09:16:32+05:30
15K+ Views

Advertisements