
 Data Structure
 Networking
 RDBMS
RDBMS Operating System
 Java
Java MS Excel
 iOS
iOS HTML
HTML CSS
CSS Android
 Python
 C Programming
 C++
C++ C#
C# MongoDB
 MySQL
MySQL Javascript
 PHP
PHP
- Selected Reading
- UPSC IAS Exams Notes
- Developer's Best Practices
- Questions and Answers
- Effective Resume Writing
- HR Interview Questions
- Computer Glossary
- Who is Who
How to put text outside Python plots?
To put text outside a plot, we can change the text position by changing the value of text_pos_x and text_pos_y
Steps
- Create data points for x and y.
- Initialize the text position of x and y.
- To plot x and y, use plot() method with color='red'.
- Use text() method to add text to figure.
- To display the figure, use show() method.
Example
import numpy as np
from matplotlib import pyplot as plt
plt.rcParams["figure.figsize"] = [7.00, 3.50]
plt.rcParams["figure.autolayout"] = True
x = np.linspace(1, 5, 100)
y = np.exp(x)
text_pos_x = 0.60
text_pos_y = 0.50
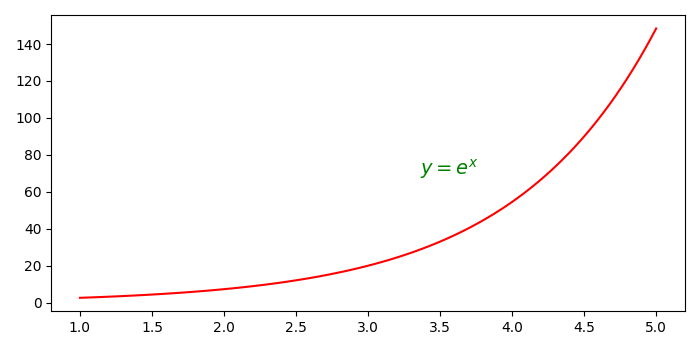
plt.plot(x, y, c='red')
plt.text(text_pos_x, text_pos_y, "$\mathit{y}=e^{x}$", fontsize=14,
transform=plt.gcf().transFigure, color='green')
plt.show()
Output

Updated on: 2021-05-06T13:03:04+05:30
3K+ Views

Advertisements