
Article Categories
- All Categories
-
 Data Structure
-
 Networking
-
 RDBMS
RDBMS
-
 Operating System
-
 Java
Java
-
 MS Excel
-
 iOS
iOS
-
 HTML
HTML
-
 CSS
CSS
-
 Android
-
 Python
-
 C Programming
-
 C++
C++
-
 C#
C#
-
 MongoDB
-
 MySQL
MySQL
-
 Javascript
-
 PHP
PHP
Selected Reading
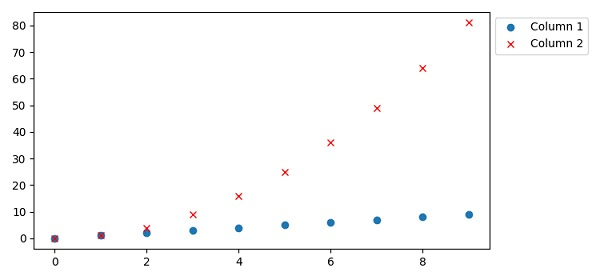
How to put a legend outside the plot with Pandas?
To put a legend outside the plot with Pandas, we can take the following Steps −
Make a dictionary d with keys Column1 and Column2.
Make a data frame using DataFrame (d).
Plot the data frame with a list of styles.
Using legend(), place a legend on the figure. The bbox_to_anchor keyword gives a great degree of control for manual legend placement. For example, if you want your axes legend located at the figure's top right-hand corner instead of the axes' corner, simply specify the corner's location, and the coordinate system of that location.
To display the figure, use the show() method.
Example
import pandas as pd
from matplotlib import pyplot as plt
plt.rcParams["figure.figsize"] = [7.50, 3.50]
plt.rcParams["figure.autolayout"] = True
d = {'Column 1': [i for i in range(10)],
      'Column 2': [i * i for i in range(10)]}
df = pd.DataFrame(d)
df.plot(style=['o', 'rx'])
plt.legend(bbox_to_anchor=(1.0, 1.0))
plt.show()
Output

Updated on: 2021-04-09T08:31:53+05:30
8K+ Views

Advertisements