
Article Categories
- All Categories
-
 Data Structure
-
 Networking
-
 RDBMS
RDBMS
-
 Operating System
-
 Java
Java
-
 MS Excel
-
 iOS
iOS
-
 HTML
HTML
-
 CSS
CSS
-
 Android
-
 Python
-
 C Programming
-
 C++
C++
-
 C#
C#
-
 MongoDB
-
 MySQL
MySQL
-
 Javascript
-
 PHP
PHP
Selected Reading
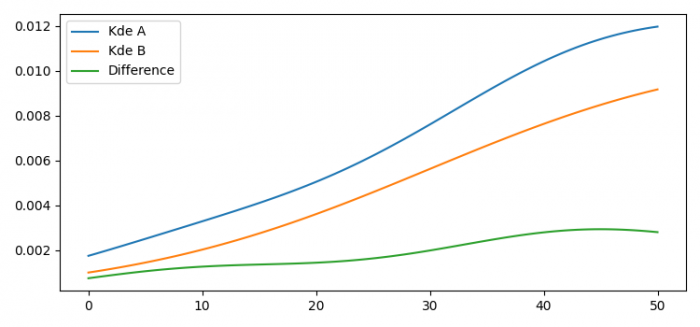
How to plot the difference of two distributions in Matplotlib?
To plot the difference of two distributions in Matplotlib, we can take the following steps −
Set the figure size and adjust the padding between and around the subplots.
Create a and b datasets using Numpy.
Get kdea and kdeb, i.e., representation of a kernel-density estimate using Gaussian kernels.
Create a grid using Numpy.
Plot the gird with kdea(grid), kdeb(grid) and kdea(grid)-kdeb(grid), using plot() method.
Place the legend at the upper-left corner.
To display the figure, use show() method.
Example
import numpy as np
import matplotlib.pyplot as plt
import scipy.stats

plt.rcParams["figure.figsize"] = [7.50, 3.50]
plt.rcParams["figure.autolayout"] = True

a = np.random.gumbel(50, 28, 100)
b = np.random.gumbel(60, 37, 100)

kdea = scipy.stats.gaussian_kde(a)
kdeb = scipy.stats.gaussian_kde(b)

grid = np.linspace(0, 50, 100)

plt.plot(grid, kdea(grid), label="Kde A")
plt.plot(grid, kdeb(grid), label="Kde B")
plt.plot(grid, kdea(grid)-kdeb(grid), label="Difference")

plt.legend(loc='upper left')

plt.show()
Output

Updated on: 2021-08-10T07:19:23+05:30
2K+ Views

Advertisements